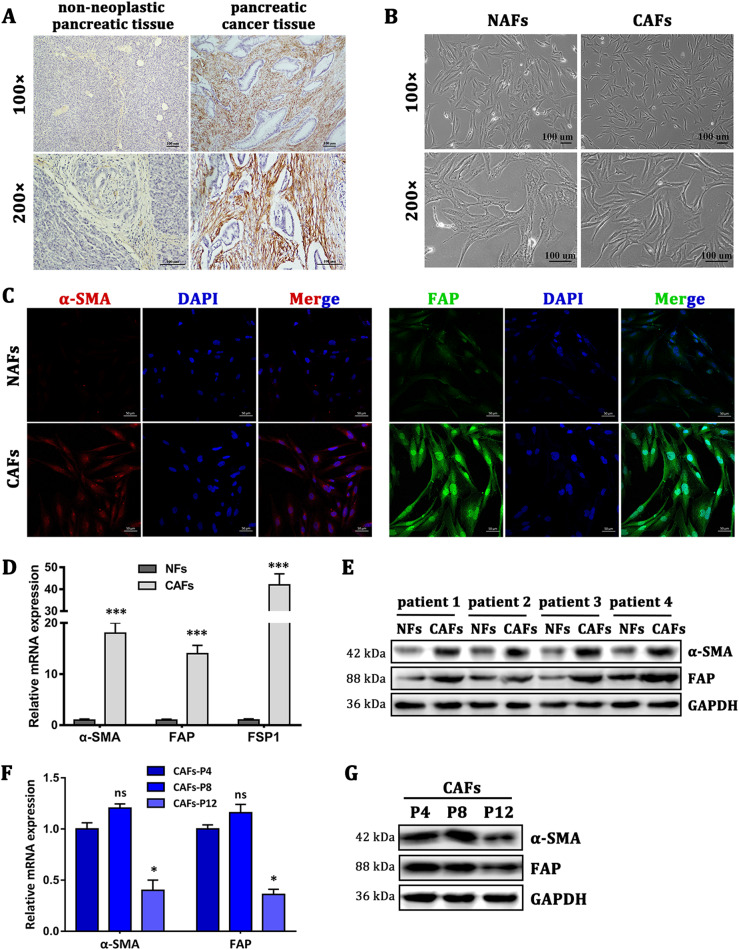
Fig. 1. Characterization of primary NAFs and CAFs.
a The expression of α-SMA in tumor stroma was assayed by immunohistochemical staining, indicating that CAFs were abundant in pancreatic tumor stroma. b The morphological images of NAFs and CAFs. c Immunofluorescence staining showed the subcellular localization and the expression of α-SMA and FAP in NAFs and CAFs. Scale bar = 50 μm, magnification, ×400. d The mRNA expression levels of α-SMA, FAP, and FSP1 in NAFs and CAFs (passage 4) isolated from three patients were detected by qRT-PCR analysis. n = 3 (replicating from three patients), ***p < 0.001. e Western blot analysis shows the expression of α-SMA and FAP in NAFs and CAFs derived from four pairs of non-neoplastic pancreatic tissues and tumor tissues. f, g qRT-PCR and western blot analysis show the different expression levels of α-SMA and FAP in CAFs at different passages. Compared with the fourth-passage CAFs (CAFs-P4), the expression of α-SMA and FAP in CAFs-P8 had no significant difference, but the expression in CAFs-P12 significantly decreased. n = 3 (replicating from three patients), ns: not significantly different, *p < 0.05

