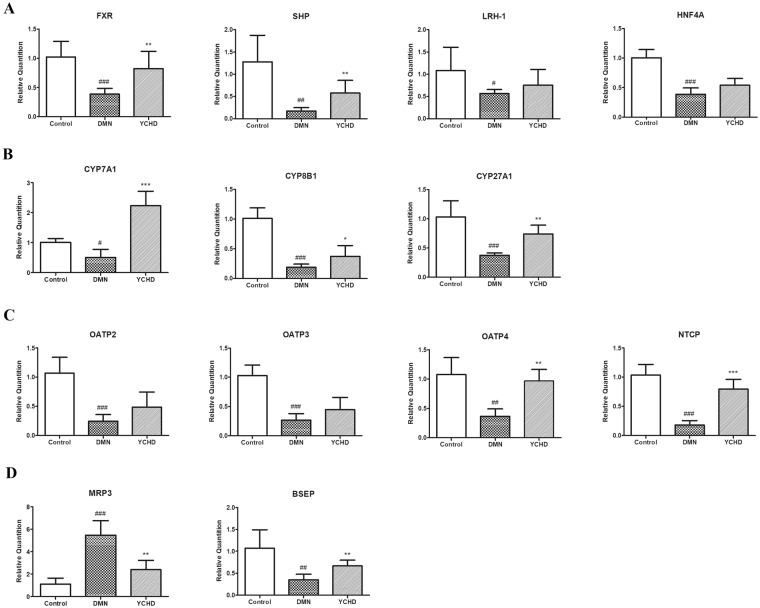
Figure 4.
Relative expression of bile acid metabolism associated genes. (A) Bile acid metabolism associated nuclear receptor genes. (B) Bile acid synthesis associated genes. (C) Bile acid reabsorption associated genes. (D) Bile acid excretion associated genes. All data were determined by RT-qPCR. ACTB was as the internal standard. Values are expressed as mean ± SD. Significant differences were analyzed by one-way ANOVA. #P < 0.05, ##P < 0.01, ###P < 0.0001 (vs. Control group).

