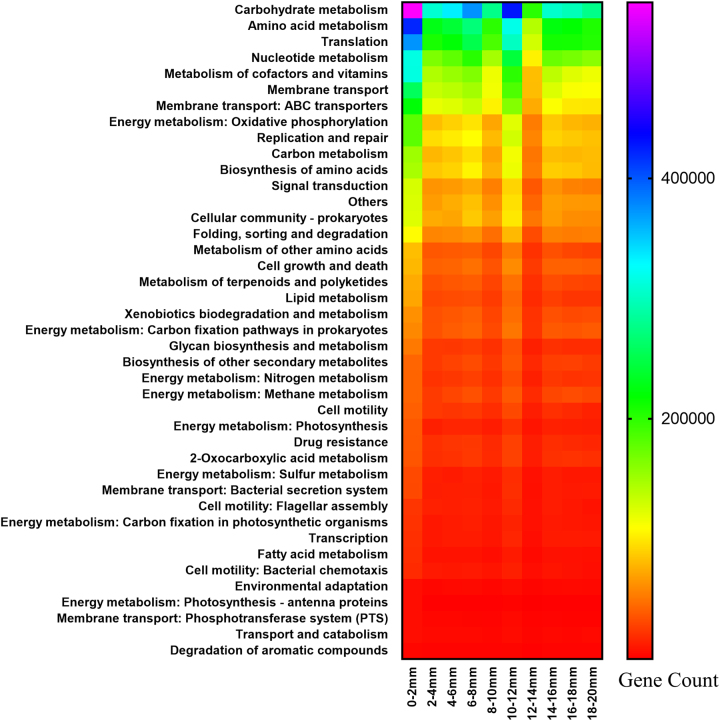
Fig. 2.
Distribution of major functional pathways with depth in Shark Bay smooth mats. These are denoted at KEGG level 3 (defined as any kind of biological reaction and/or gene expression regulation), with the exception of the energy metabolism shown at KEGG level 2 (defined as molecular interactions/protein post-translational modifications). X-axis indicates the different smooth mat layers in 2 mm increments, and y-axis indicates major functional genes/pathways. Scale bar represents gene count as the relative abundance of relevant genes associated with the displayed functions

