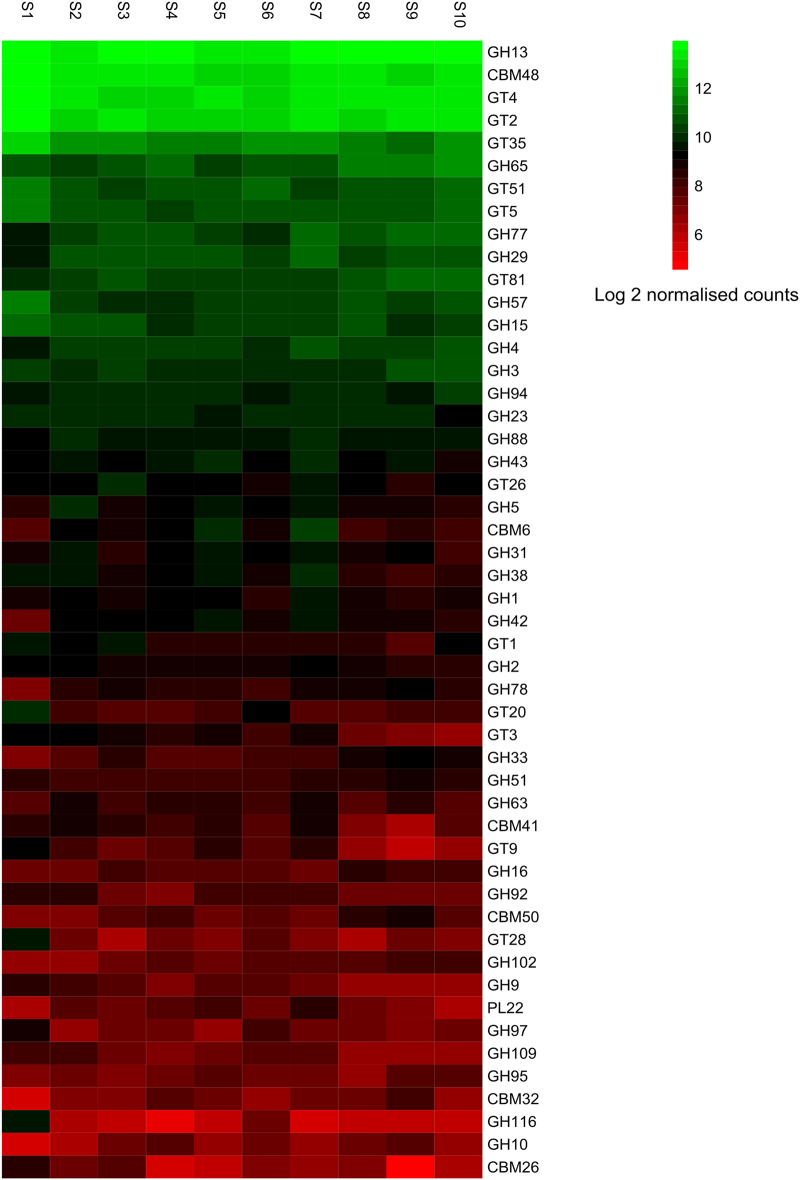
Fig. 6.
Heatmap of distribution of genes encoding carbohydrate-active enzymes (CaZY) in Shark Bay smooth mats. Differential analysis of count data (given as log2 normalized counts) was obtained using the DESeq2 package in R and used to compare the abundance of the top most 50 CaZY genes with depth in the mats. Green represents genes that are more over-represented and red indicates genes that have the least relative abundance. X-axis indicates the different smooth layers in 2 mm increments (S1, 0–2 mm; S2, 2–4 mm; S3, 4–6 mm; S4, 6–8 mm; S5, 8–10 mm; S6, 10–12 mm; S7, 12–14 mm; S8, 14–16 mm; S9, 16–18 mm; S10, 18–20 mm), and the y-axis the major functional genes identified. GH glycoside hydrolase, CBM carbohydrate-binding modules, GT glycosyltransferase, PL polysaccharide lyase

