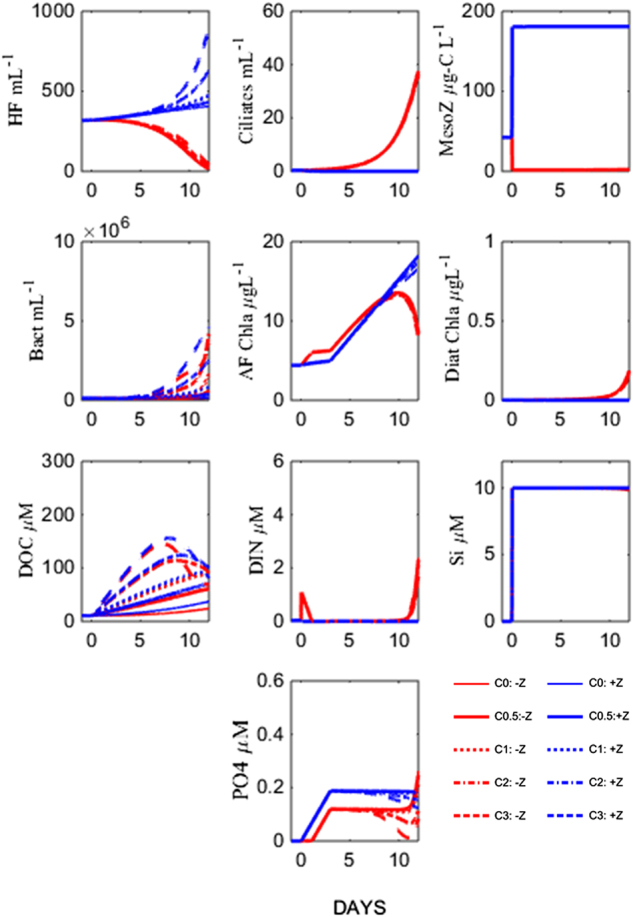
Fig. 6.

Model run with two groups of bacteria, one group with the same parameters as in the initial model and one Winnie-the-Pooh strategist group with reduced clearance rate (from heterotrophic flagellates) and increased mineral nutrient affinity when free glucose is present (see SI for details). Thereby, the difference in modelled bacterial abundance and DOC levels between the +Z and –Z levels is reduced compared to the initial model run (Fig. 2). The blue and red lines represent Z+ and Z− treatments, respectively
