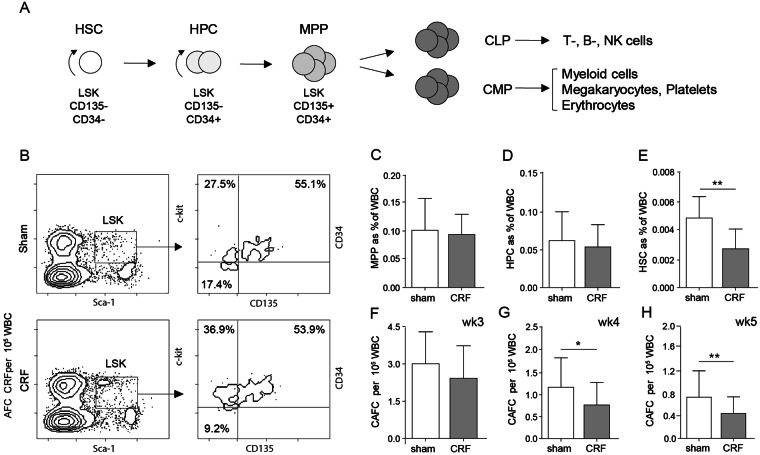
Figure 2.
HSC numbers are decreased in the BM of CRF mice. (A) Scheme of hematopoiesis and the phenotypes of HSC, HPC and MPP. LSK indicates Lin−Sca-1POSc-KitHI cells. Common myeloid progenitor (CMP), common lymphoid progenitor (CLP) (B) FACS plots for the identification of stem cell subsets. Representative plots for sham-operated controls (sham) and CRF mice are shown. Using FACS analysis the frequency of (C) MPP, (D) short-term repopulating HPC and (E) long-term repopulating HSC were determined phenotypically (n = 9–13/group). The percentages in the dotplot (B) refer to the percentages of MPP, HPC and HSC in the LSK population, while the percentages in the graphs (C–E) refer to the percentages of cells with all bone marrow cells. Using a CAFC assay, the frequency of CAFC (F) week 3, (G) week 4 and (H) week 5 was assessed functionally (n = 8 per group). Means ± SD are depicted. *p < 0.05 and **<0.01.

