Figure 6.
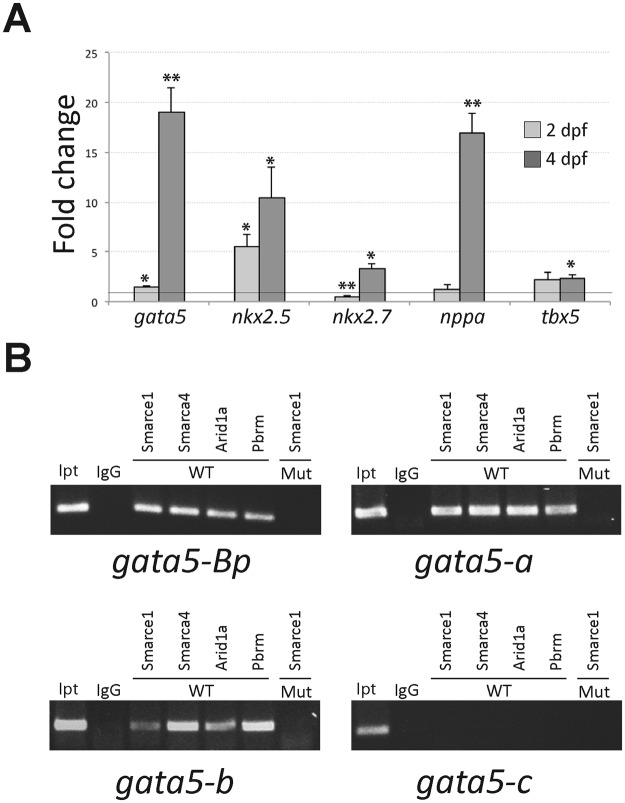
(A) Quantitation by QPCR of gene expression of cardiac factors. 2 dpf and 4dpf embryos were genotyped and evaluated. For all genes n ≥ 3. *P < 0.05, **P < 0.01. (B) In vivo Smarce1-binding sites were detected by chromatin immunoprecipitation using a SMARCE1 antibody. Cropped gel images representing typical results from ChIP assays in: the regulatory module located from the transcription initiation site +1 to −1415, which includes the basic promoter (gata5-Bp), the module located from −1469 to −1892 (gata5-A), the module located from −7823 to −8213 (gata5-B) and the module located from −16805 to −17147 (gata5-C). IgG, Smarce1, Smarca4, Arid1a and Pbrm indicate the PCR products from genomic DNA precipitated using the corresponding antibody. WT and Mut indicate the source of genomic DNA. The input is the PCR product from the total input genomic DNA. Full-length gels are presented in Supplementary Figure 3.

