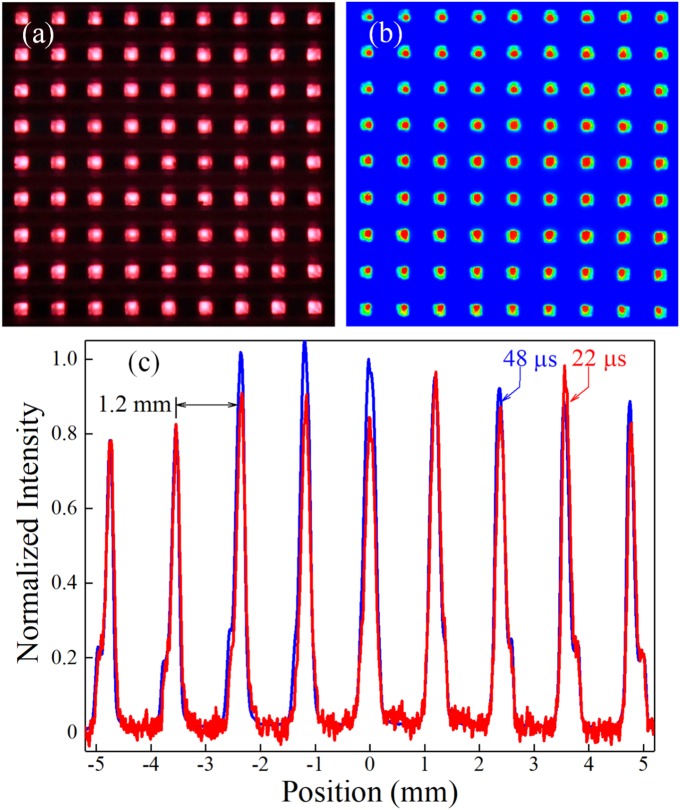
Fig. 2.
End-on optical images and lineouts illustrating the uniformity of the microplasma columns emerging from the array device: a Visible emission produced from each of the 81 channels in the array when He is the feedstock gas; b false color image of the emission, and c lineouts of the array emission recorded 22 µs (red) and 48 µs (blue) following the zero-crossing of the positive half-cycle of the sinusoidal voltage waveform. The microchannels represented in c are those forming the central column in the arrays of a and b. All images were recorded with a 20 kHz sinusoidal voltage having an RMS value of 1.2 kV

