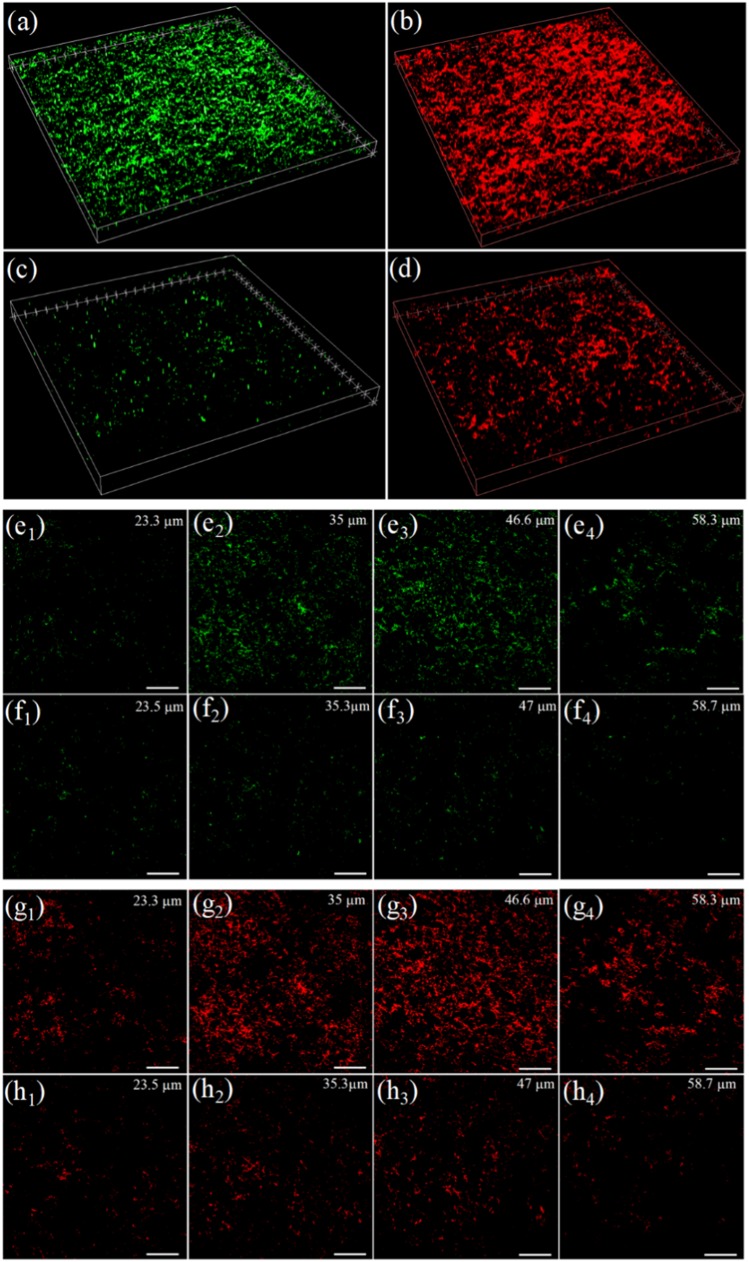
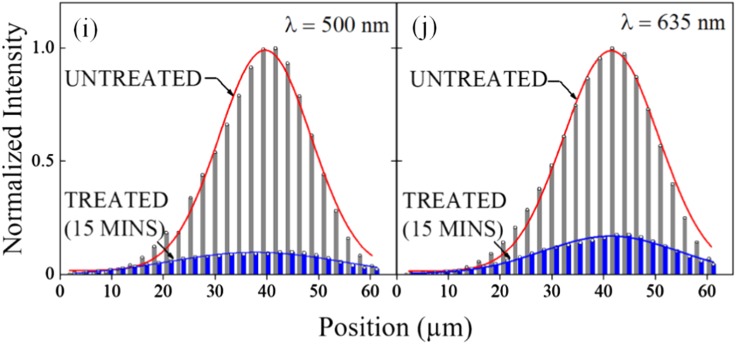
Fig. 4.
CLSM images of the biofilm of Fig. 3, recorded prior to and after exposure of the film to the microplasma array: a, b 3D images of the biofilm at t = 0 (immediately prior to microplasma treatment), indicating the distribution of living cells (panel a, SYTO 9 fluorophore, λ = 500 nm) and deactivated cells (b, propidium red fluorophore, λ = 635 nm); c, d CLSM images corresponding to those of a and b, respectively, but recorded after 15 min. of treatment of the biofilm with low temperature plasma; e–h Series of CLSM images recorded for SYTO 9 (green, λ = 500 nm) staining, at several values of depth into a biofilm (e1–e4, f1–f4). The row of images at top (e1–e4) were obtained prior to treatment of the biofilm with plasma, while those in the lower row (f1–f4) were acquired after 15 min. of exposure to the microplasma array. The white horizontal bars in each panel represent a length of 200 µm; g1–g4, h1–h4: Images corresponding to those of Fig. 4 e1–e4 and f1−f4 but recorded by mapping the fluorescence from propidium red (λ = 635 nm). Again, the horizontal bars represent a length of 200 µm; i, j: Summary of the green (SYTO 9, λ = 500 nm, panels e and f) and red (propidium red, λ = 635 nm, panels g and h) fluorescence depth profiles, measured for biofilms that were untreated (light gray bars) and those treated by exposure to the microplasma jet array for 15 min. (dark blue bars). The red curves represent the fitting of a Gaussian to the data


