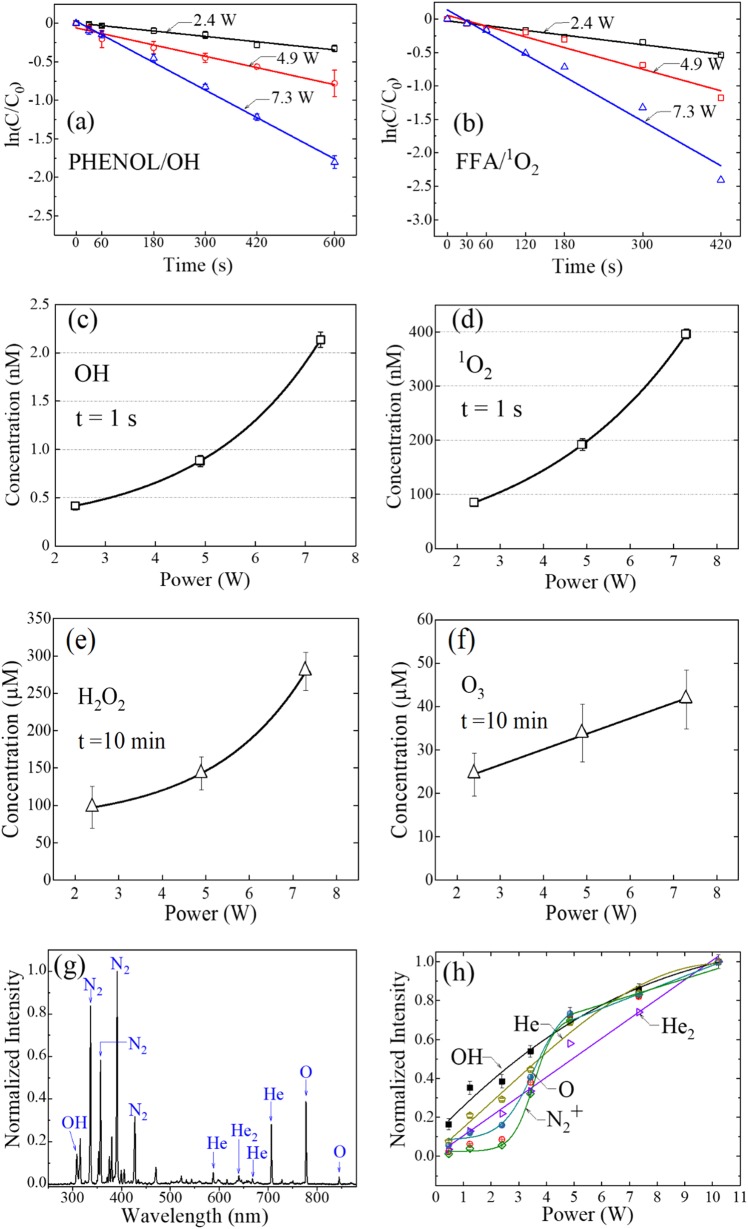
Fig. 5.
a–d Concentrations of OH, and 1O2 produced by a He microplasma jet array in phenol or FFA solutions: a Decay of the phenol concentration, C (relative to its initial value C0), for microplasma exposure times up to 600 s. Data are presented for several values of power delivered to the 9 × 9 array, and note that the ordinate is logarithmic; b Data similar to those of a but for FFA in a PBS solution; c Concentration of OH, calculated from the data of a, for three values of power dissipated by the plasma; d Dependence on microplasma array power of the 1O2 concentration (calculated from b). The results of panels c and d are those recorded after only one second of exposure of the phenol/PBS or FFA/PBS solutions to the plasma; e–f: Measurements of the concentrations of: H2O2, and O3 after 10 min. of plasma array exposure to PBS solutions. Data are given for three values of power (P) dissipated by the microplasma jet array; g Emission spectrum of the 9 × 9 microplasma jet array, recorded end-on over the 300–850 nm spectral interval. The He backing pressure for the jets was 785 Torr (300 K pressure), the driving voltage was a 20 kHz sinusoid, and the array emerged into room air; h Variation with peak driving voltage of the normalized fluorescence generated by several selected emitters. The oxygen atomic transition is the 777 nm line of panel g

