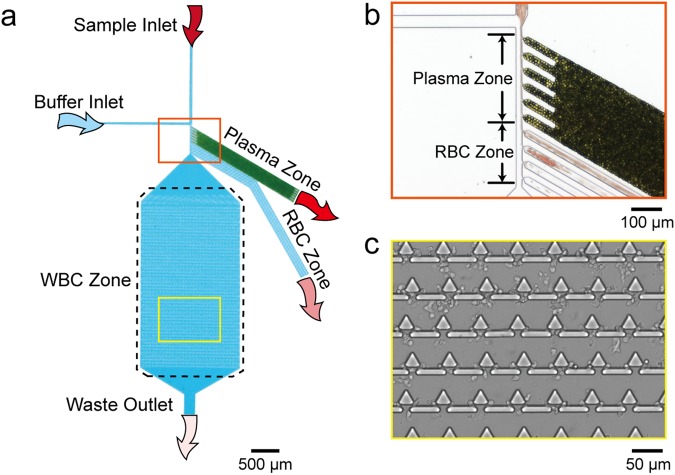
Figure 1.
(a) Schematic of the microfluidic device, which contains a whole blood sample inlet and a buffer inlet, respectively. After the whole blood sample flowed to the bifurcation region (orange zone), plasma and RBCs were extracted to plasma zone and RBC zone, respectively. WBCs flowed to the main channel and were trapped in the WBC zone. (b) Photograph of the plasma zone and RBC zone entrance. Green particles are packed beads, and red particles are RBCs. (c) Photograph of the WBC zone with trapped WBCs.

