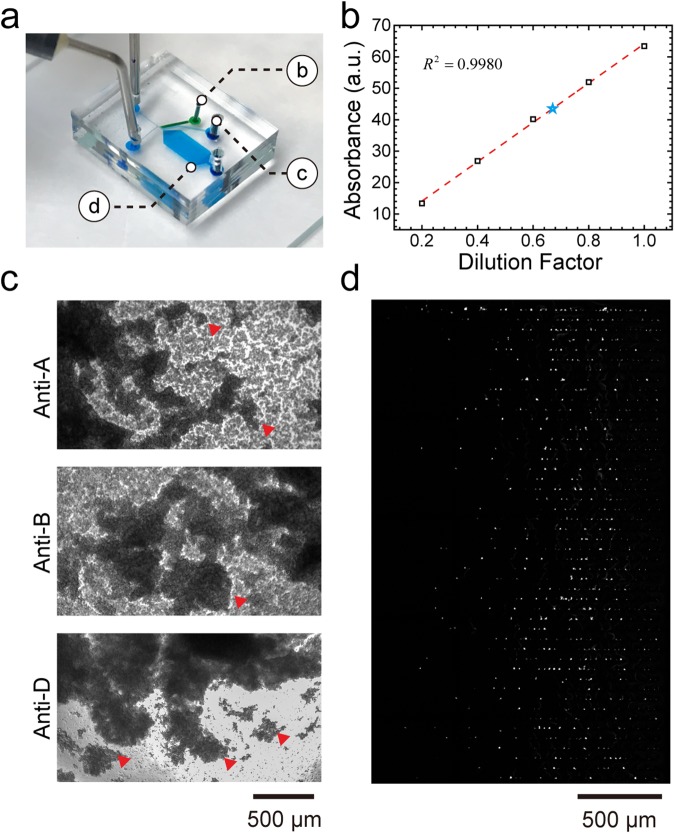
Figure 6.
Simultaneous extraction of plasma, RBCs and on-chip white blood cell trapping. (a) Image of the microfluidic device showing the position of each zone. (b) Standard curve of the absorbance intensity versus dilution factor of manually diluted blood (black rectangles and red dashed line). The blue star represents the absorbance and corresponding dilution factor (0.67x) of extracted plasma in this test. (c) Blood type test images from the extracted RBC solution. The red triangles represent blood agglutination. (d) WBC seeding pattern in the WBC zone.

