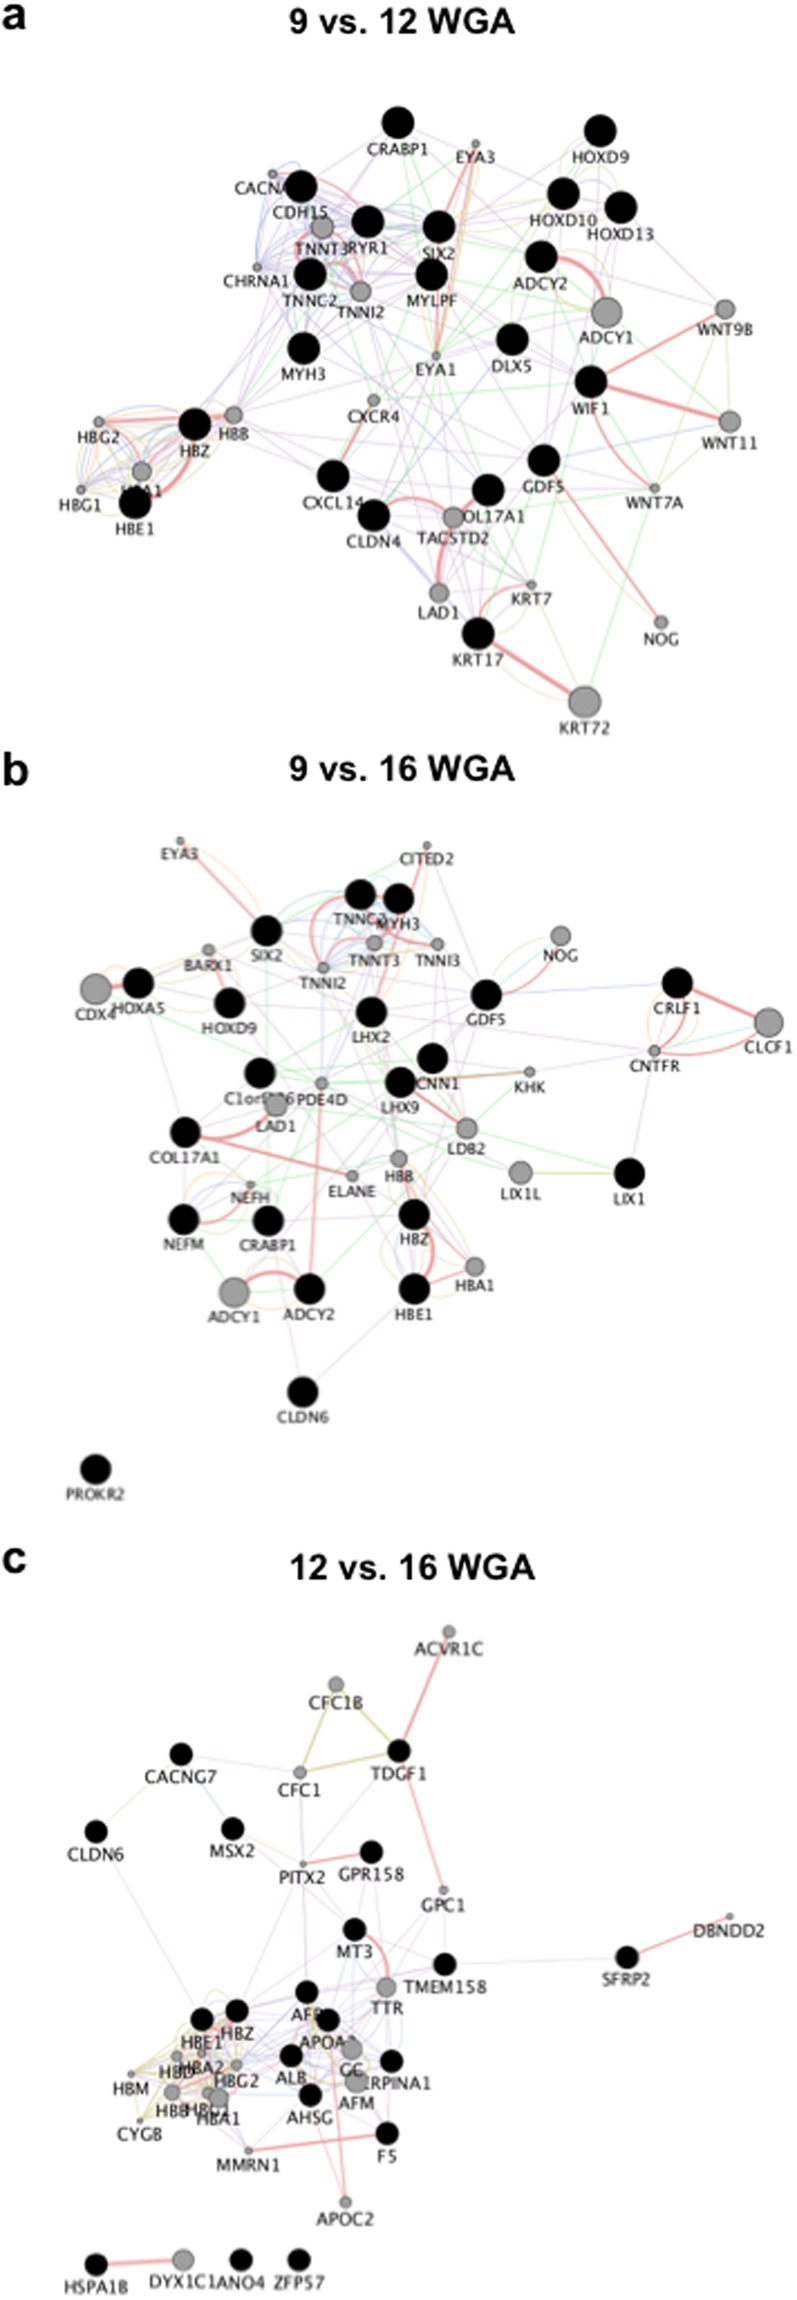
Figure 3.

Predictive gene network analysis for significantly downregulated genes. We performed that same predictive gene network analysis as in Fig. 2, except the 20 genes with the greatest log2 fold decrease between age comparisons (black circles) were used. (a–c) Network analysis for 9 compared to 12 weeks gestation age (WGA), 9 compared to 16 WGA, and 12 compared to 16 WGA. The most significant gene ontology functions were analysed from the resultant network (see Main Text). Edges are colour coded to signify the predicted connections between nodes; co-expression: purple; co-localisation: blue; genetic interactions: green; shared protein domains: yellow; predicted: orange; physical interactions: pink; pathway: light blue.
