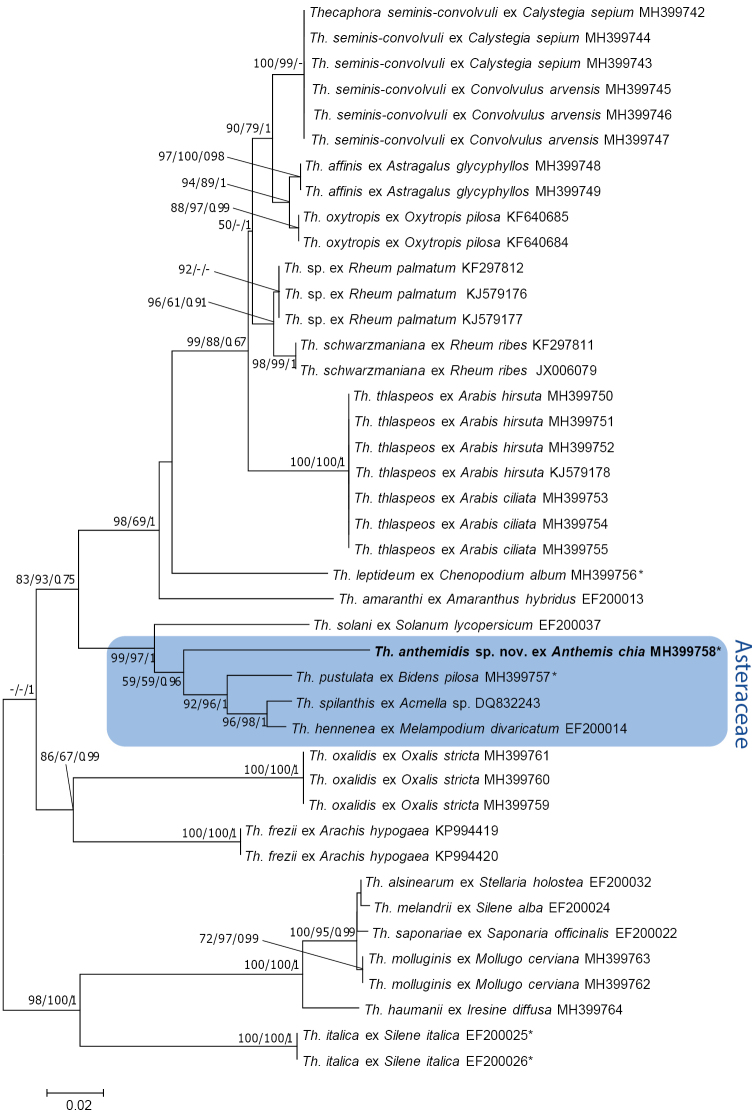
Figure 1.
Phylogenetic tree of Thecaphora species based on ME analysis of the ITS locus. Numbers on branches denote support in ME, ML and BA, respectively. Values below 50% are denoted by ‘–‘. The bar indicates the number of substitutions per site. Ex-type sequences are highlighted with an asterisk.

