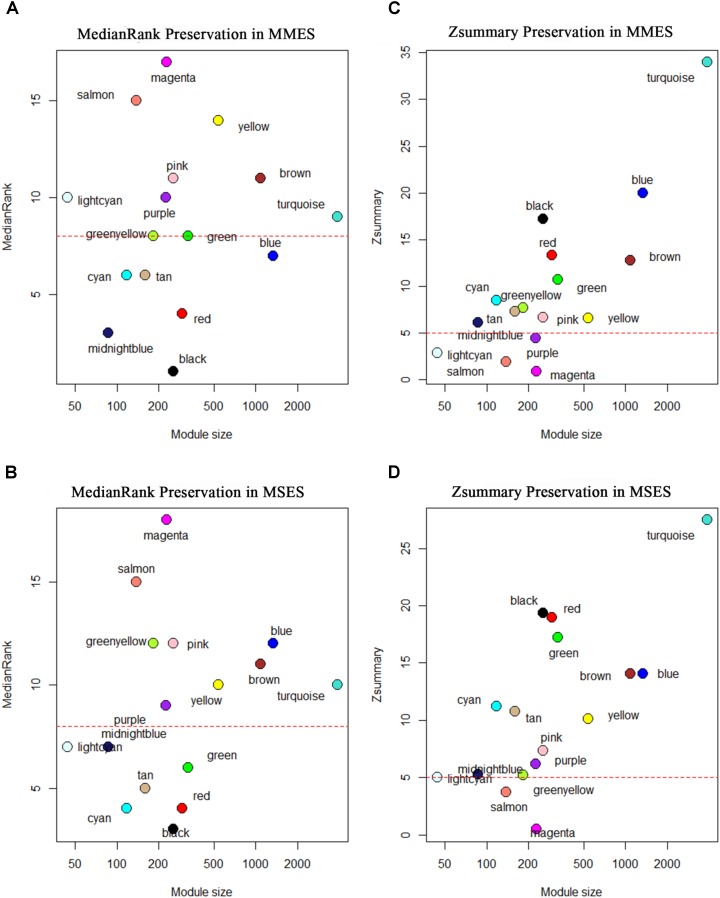
FIGURE 4.
Composite preservation statistics of reference modules after assignment in minimal/mild (MMES) and mild/severe (MSES) ES data (as test data): (A,B) the composite statistic medianRank (y-axis) as a function of the module size; each point represents a module, labeled by color. The dashed red line indicates the threshold medianRank = 10; (C,D) the summary statistic Z (y-axis), as a function of the module size; each point represents a module, labeled by color as in (A). The dashed red line indicates the threshold Z = 5. A module was considered as non-preserved if it had medianRank ≥ 8 or Zsummary < 5.

