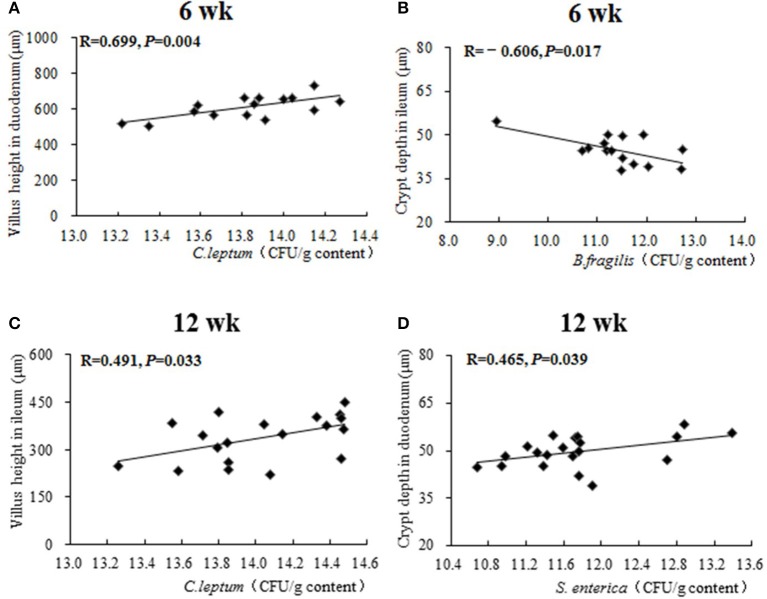
Figure 5.
The Pearson correlation analysis between caecal microbiota and intestinal morphology. The plots represent the samples in all treatments from 0 to 16 weeks, the transverse line represents the linear relationship between caecal microbiota and intestinal morphology. R-value: Pearson correlation coefficient, R > 0 represents positive correlation: R < 0 represents negative correlation. P-value: significance was declared at P < 0.05. (A) Correlational relationship between population of caecal C. leptum and villus height in duodenum at week 6; (B) Correlational relationship between population of caecal B. fragilis and crypt depth in ileum at week 6; (C) Correlational relationship between population of caecal C. leptum and villus height in ileum at week 12; (D) Correlational relationship between population of caecal S. enterica and crypt depth in duodenum at week 12.

