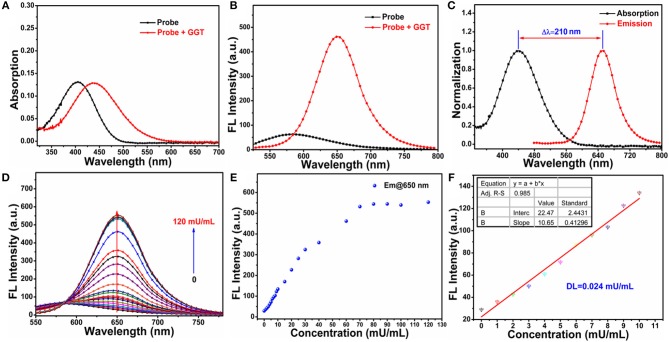
Figure 1.
(A) UV-Vis and (B) fluorescence spectra changes of probe NIR-SN-GGT (10 μM) toward adding 60 mU/mL γ-GGT enzyme in PBS buffer solution (0.01 M, pH 7.4). (C) Normalization UV-Vis (blank line) and fluorescence spectrum (red line) of NIR-SN-NH2 in PBS buffer solution (0.01 M, pH 7.4). (D) Fluorescence titration experiments of probe NIR-SN-GGT (10 μM) toward different concentrations of γ-GGT enzyme (titration concentrations: 0, 1, 2, 3, 4, 5, 6, 7, 8, 9, 10, 15, 20, 25, 30, 40, 60, 70, 80, 90, 100, 120 mU/mL). (E) Fluorescence intensities of probe NIR-SN-GGT (10 μM) around 650 nm toward various concentrations of γ-GGT enzyme (0-120 mU/mL). (F) The linearity of F650nm vs. low concentration of γ-GGT ranging from 0 to 10 mU/mL. The experiments were repeated three times and the data were shown as mean (±S.D.). λex = 445 nm, slit: 10/10 nm.

