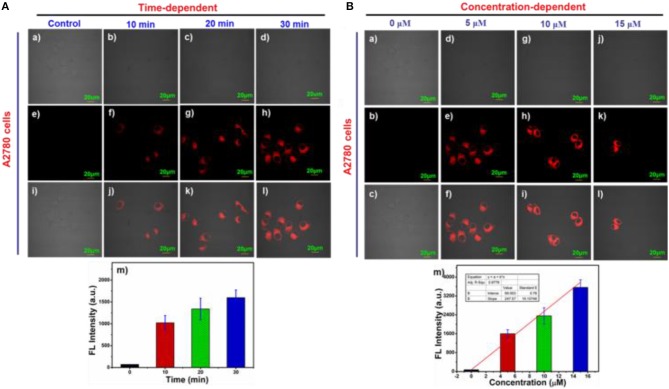
Figure 4.
(A) Time and (B) Concentration-dependent imaging of probe NIR-SN-GGT in A2780 cells. (a–d) bright imaging; (e–h) fluorescence imaging; (i–l) merged imaging; (m) fluorescence emission intensities of NIR channel were measured as averages of 9 regions of interest (ROIs) from different treated A2780 cells. Error bar = RSD (n = 9). λex = 488 nm and λem = 655–755 nm. Scale bar = 20 μm.

