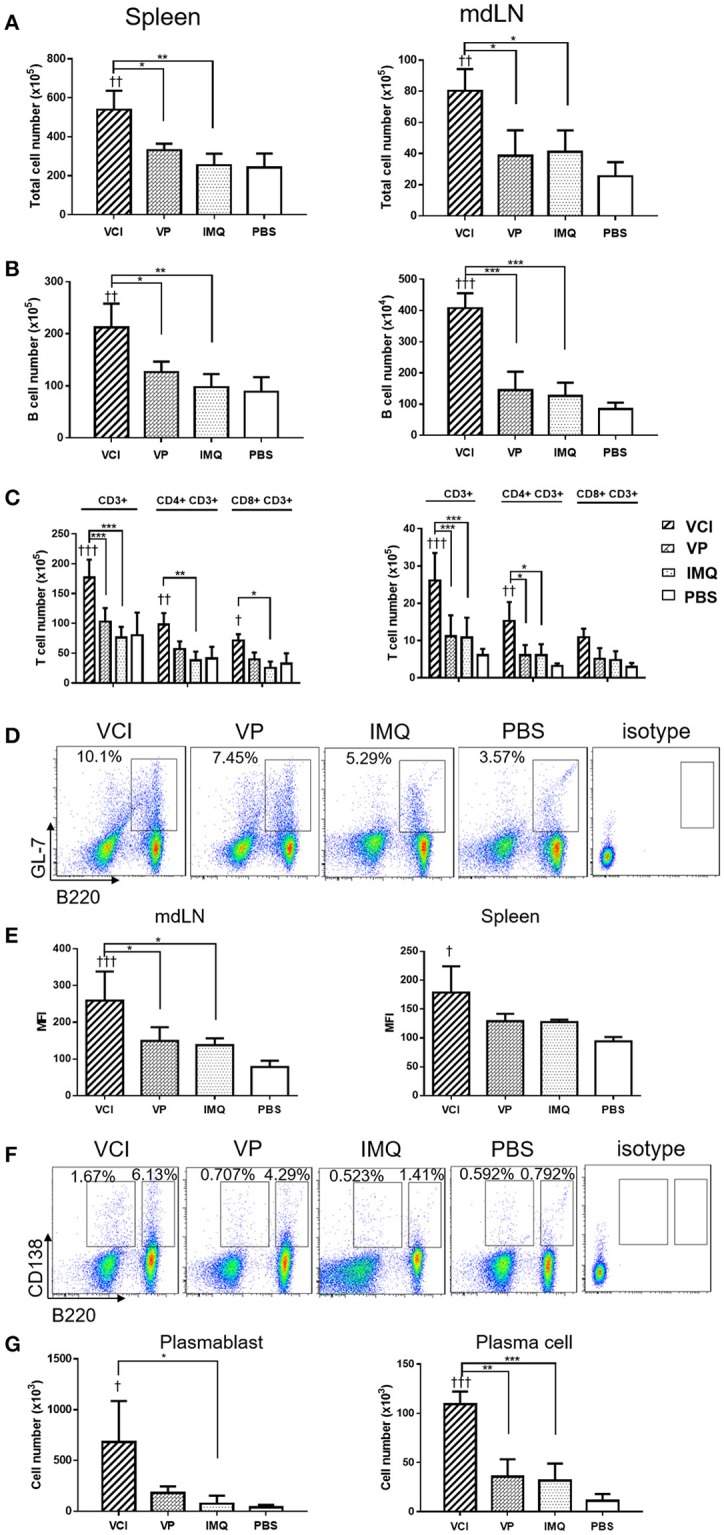
Figure 6.

B cell responses in VCI immunized mice at 3 days after H1N1/415742Md virus challenge. Mice received intraperitoneal administration of VCI (IMQ 50 μg + VP 10 μg), IMQ (50 μg), VP (10 μg), or PBS for 3 days, and then were challenged with 10 × LD50 of H1N1/415742Md virus intranasally. At 3 days post virus challenge, spleens and mdLNs were examined. (A) Increased total cell count of spleen (left) and mdLN (right). (B) Total B cells numbers in the spleen (left) and mdLN (right) determined by flow cytometry. (C) T cells numbers in the spleen (left) and mdLN (right) determined by flow cytometry. (D) Representative flow cytometry dot plot of GL7 expression on B cells in spleen. (E) MFI of GL7 expression on B cells in mdLN (left) and spleen (right). (F) Representative flow cytometry dot plot of plasmablast (B220+CD138+), and plasma cell (B220−CD138+) in the mdLN, cell gated on lymphocyte singlets. (G) Plasmablasts (left) and plasma cells (right) number detected in mdLN. n = 3 for all experiments. †p < 0.05; ††p < 0.01; †††p < 0.001 (compared with PBS group). *p < 0.05; **p < 0.01; ***p < 0.001; (compared VCI group with other treatment group).
