
FIGURE 2.
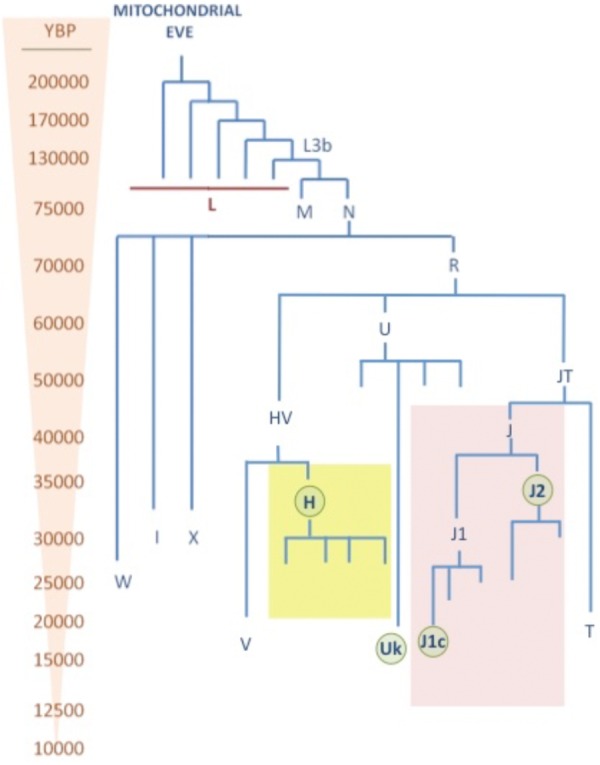
mtDNA phylogenetic tree. This tree shows the age (YBP) of different mtDNA haplogroups. The major Caucasian haplogroups H, U, and J are highlighted in yellow, blue, and red, respectively. Sub-haplogroups which has shown pleiotropic effect in neurodegenerative diseases are highlighted with green circles.