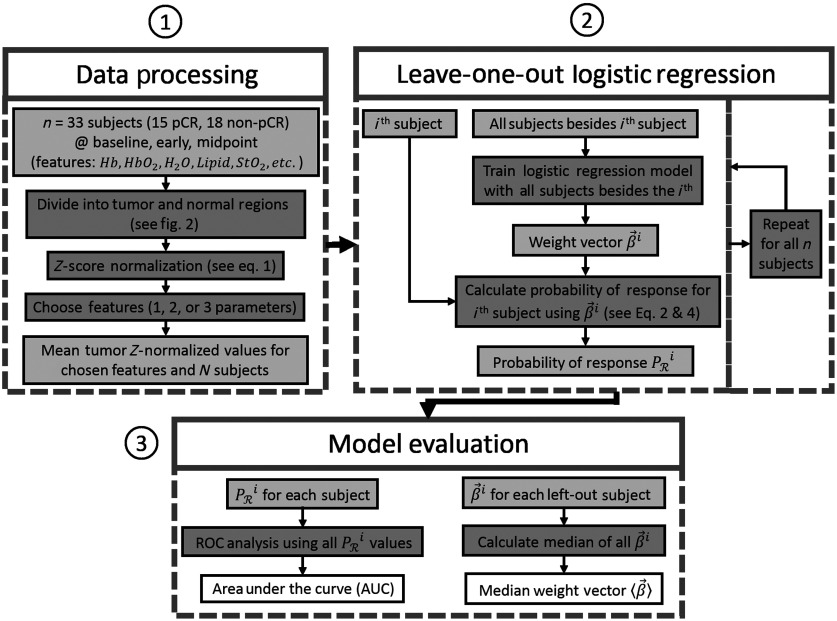
Fig. 3.
Data analysis flowchart. (1) Data processing—measured quantities at all spatial points and all subjects across the first three timepoints are first divided into tumor and normal (healthy) regions (see Fig. 1). All tumor points are then -score normalized to their respective normal (healthy) regions [see Eq. (1)], and the mean is taken for a given subject and timepoint. Finally, one-, two-, or three-model parameters are chosen from among the combinations of measured quantities and timepoints as model inputs. (2) Leave-one-out logistic regression—a set of logistic regression algorithms are performed, each of which leaves out a single subject from the training data and produces a weight vector. Each is then used to calculate the probability of response for the subject left out of the given training set [see Eqs. (2) and (4)]. (3) Model evaluation—ROC analysis is performed using the calculated values to determine the AUC and a median weight vector is calculated from the resulting vectors.

