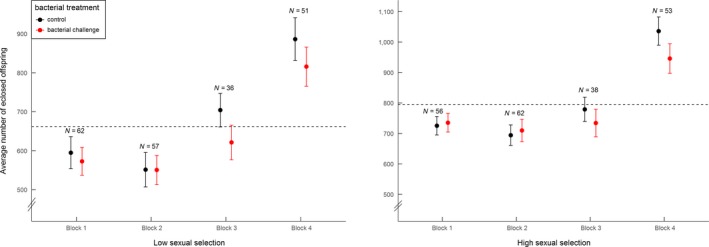
Figure 3.

Effect of bacterial treatment (bacterial challenge or control) and selection treatment (low sexual selection or high sexual selection) on male reproductive success, shown across the four different blocks. Graphs show raw data (mean ± SE), with total sample sizes per block displayed above the means. Average mean reproductive success (across blocks and treatment) is illustrated by horizontal hatched line
