
Extended Data Fig. 6. Genetic and phenotypic alterations induced by delivery of gM/SpCas9 and gMH/SpCas9 in vivo.
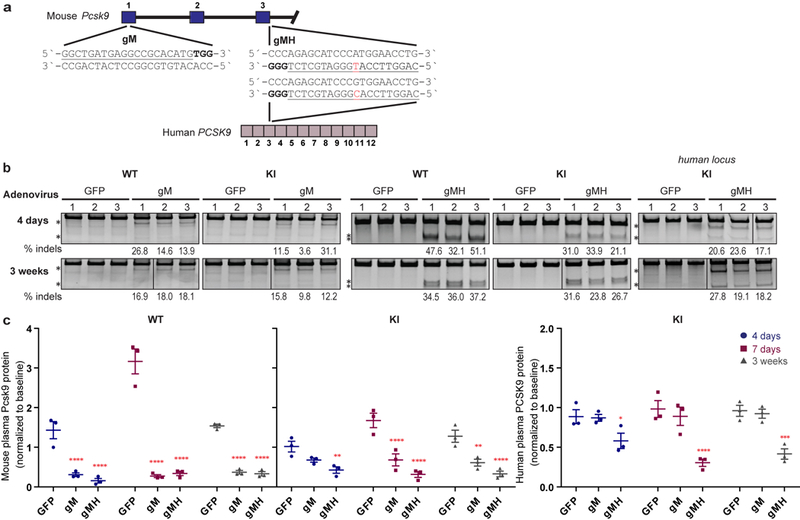
(a) Sequence and location of the SpCas9 gM (mouse) and gMH (mouse & human) gRNA target sites in the endogenous mouse Pcsk9 gene and human PCSK9 transgene inserted at the mouse Rosa26 locus. The single base position that differs between the gMH target sites in the mouse Pcsk9 gene and the human PCSK9 transgene is highlighted in red. Blue bars indicate exons for the mouse genomic region while purple bars represent exons for the human genomic locus; PAM sequence for the sites is in bold and the spacer sequence is underlined. (b) Surveyor assay and next-generation DNA sequencing data demonstrating efficient in vivo modification of the on-target endogenous mouse Pcsk9 site and human PCSK9 transgene in mouse liver. Assays were performed 4 days and 3 weeks following administration of adenoviral vectors encoding gM and SpCas9 (“gM”), gMH and SpCas9 (“gMH”) or GFP and SpCas9 (“GFP”) using genomic DNA isolated from livers of n=3 biologically independent WT and KI mice. Asterisks indicate cleaved PCR products expected following treatment with Surveyor nuclease. Percentages show the frequencies of indel mutations determined by targeted amplicon sequencing using next-generation sequencing (these are the same values shown for the on-target sites in Fig. 3 and Extended Data Fig. 7). Lines divide lanes taken from different locations on the same gel. For source data for Surveyor assays, see Supplementary Fig. 1. For source data for targeted amplicon sequencing, see Supplementary Tables 6 and 7 for gM and gMH, respectively. (b) Plasma mouse Pcsk9 protein levels in n=3 biologically independent WT and KI mice, and plasma human PCSK9 protein levels in n=3 biologically independent KI mice following CRISPR-Cas nuclease treatment. Plasma protein levels were assessed 4 days, 7 days, and 3 weeks following administration of gM, gMH, or control GFP adenoviral vectors and normalized to baseline levels at each timepoint. Significant differences between groups were determined using two-way ANOVA and Dunnett`s two-sided adjusted multiple comparisons test, p *<0.05, **<0.01, ***<0.001, ****<0.0001. See source data for Extended Data Figure 6 for exact adjusted P values. Values are presented as group means, error bars represent standard errors of the mean (SEM).