
Figure 1.
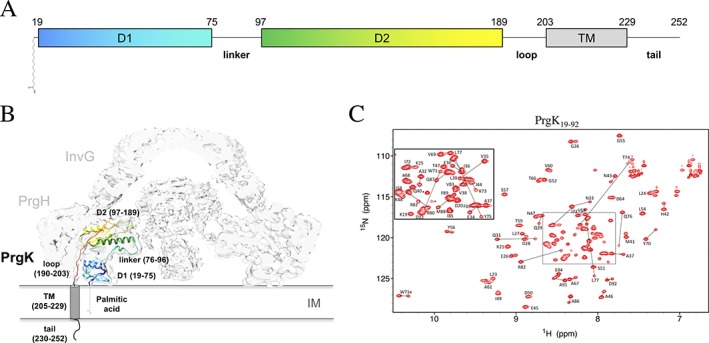
Structure and conformations of the PrgK periplasmic domain. (A) Schematic representation of PrgK, with the boundaries of the D1, linker, D2, loop and TM indicated, along with an N‐terminal cysteine‐linked palmitic acid. (B) Cartoon representation of the PrgK structure (colored; PDB ID 5TCP) in the cryo‐EM map of the basal body complex17 (EMDB ID 8398). (C) Assigned 15N‐HSQC spectrum of the PrgK19–92 construct, reproduced from reference 12. The lines connect the two 1HN‐15N peaks yielded by the residues that differ in the two conformers of this construct