Figure 4.

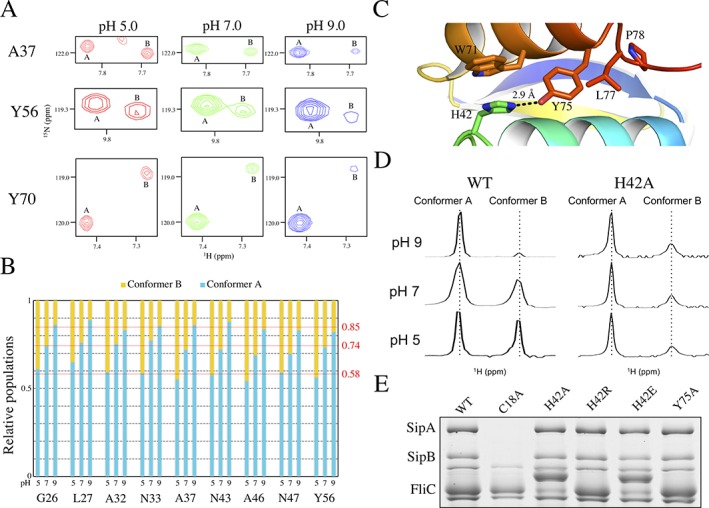
The PrgK population ratio is affected by pH. (A) Selected regions from the overlaid 15N‐HSQC spectra of PrgK19–92 at pH 5 (red), pH 7 (green) and pH 9 (blue). With increasing pH, the corresponding signals from conformer B become weaker relative to those from conformer A. (B) The relative populations of the A and B conformers, IA/(IA + IB) and IB/(IA + IB), determined from corresponding 15N‐HSQC peak intensity ratios, are plotted for selected residues as a function of sample pH value. The relative population of conformer A increases from ∼0.58 at pH 5 to 0.74 at pH 7 and 0.85 at pH 9. Thus, PrgK19–92 preferentially adopts conformer A under more alkaline conditions. Note that peak intensities are also dependent upon amide hydrogen exchange and the relaxation behavior of the 1HH and 15N nuclei, which may differ between conformers A and B. Hence, these intensity ratios are only an approximation of population ratios. (C) Cartoon representation of the PrgK D1 structure in conformer A (PDB ID 4W4M), centered around the salt bridge formed by residues His42 and Tyr75. (D) Expanded, aligned regions of the 1D 1H‐NMR spectra corresponding to the resolved downfield indole 1Hɛ1 signal (∼ 10.5 ppm) of Trp71, for PrgK19–92 WT or with the H42A mutation, at various pH conditions. In the WT protein, two peaks corresponding to the two populations are clearly visible, and their relative intensity varies with sample pH value, as also seen for amides in the spectra of panel A. In contrast, with the H42A mutant, the relative peak intensities are pH‐independent. Although conformer B appears minor in these 1D spectra, in 15N‐HSQC spectra, most amides show approximately equal 1HN‐15N peak intensities for conformers A and B (Fig. S5). (E) Secretion assay for mutants of His42 and Tyr75, performed as in Figure 3(B). None of the mutations affects secretion in this assay
