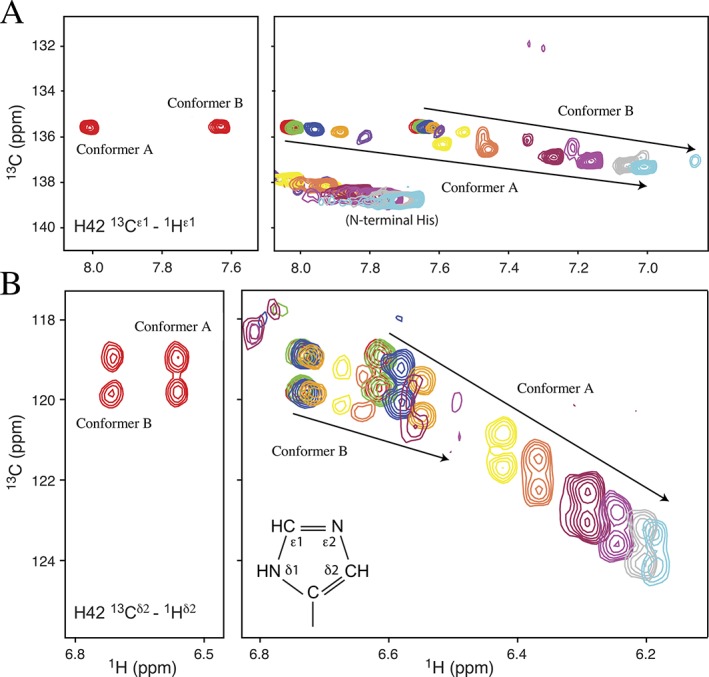
Figure 5.

pH‐dependent chemical shifts of His42. The pK a values of His42 were determined from 15N‐decoupled 13C‐HSQC spectra of PrgK19–92 selectively‐labeled with 13C/15N‐histidine. (Left) Assigned spectra recorded at pH 5.2 showing the (A) 13Cɛ1‐1Hɛ1 and (B) 13Cδ2‐1Hδ2 signals. Each 13Cδ2 signal is a doublet due to scalar coupling with adjacent the 13Cγ. (Right) Eleven superimposed spectra recorded as the sample was titrated in small steps from pH 5.2 (red) to 8.7 (light blue). Signals from conformer B diminish in intensity as conformer A is increasingly favored under alkaline conditions. The nomenclature is illustrated for the neutral Nδ1H tautomer of a histidine sidechain
