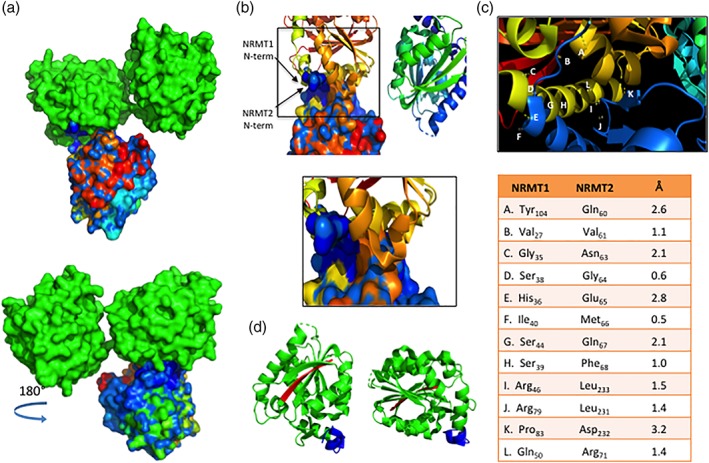
Figure 4.

Modeling of NRMT1 and NRMT2 heterotrimer. (a) Top—Space‐filling model showing area of interaction between the NRMT1 dimer (green) and NRMT2 monomer (multicolored). Bottom—180° rotation of the heterotrimer model. The NRMT2 monomer is shaded with a blue‐to‐red gradient, representing the N‐terminal to C‐terminal orientation of the amino acid sequence. The majority of interactions between the NRMT1 dimer and NRMT2 monomer are predicted to involve the blue (N‐terminus) shaded region of NRMT2. (b) Ribbon diagram of the NRMT1 dimer interacting with the space‐filling model of the NRMT2 monomer. The N‐termini of both NRMT1 and NRMT2 are labeled. Boxed region is enlarged below and shows the majority of residues of interaction are found in the N‐terminus of both enzymes. (c) Diagram of and measured distances between interacting residues of NRMT1 and NRMT2. Each interaction is denoted in the enlargement above by the corresponding letter. (d) Ribbon diagram of NRMT1 homodimer, indicating N‐termini of each monomer (blue) are oriented in the same plane. C‐termini are colored red. All interactions were modeled with PyMOL using PDB accessions codes 2EX4 and 5UBB.
