Figure 8.

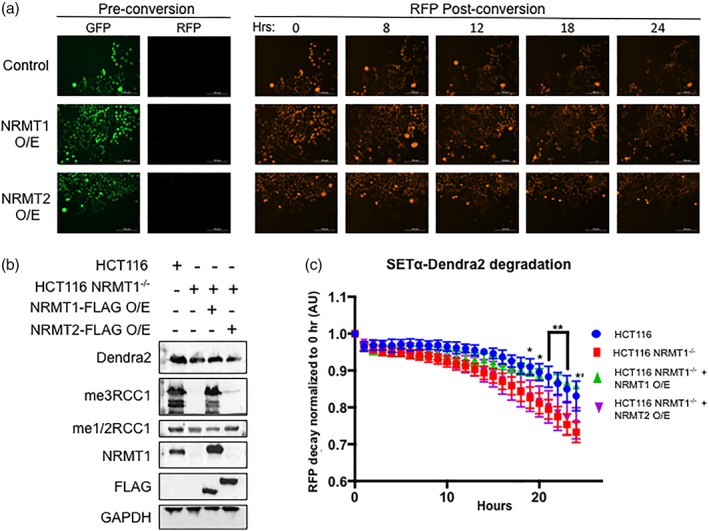
NRMT2 overexpression cannot rescue NRMT1 knockout phenotypes. (a) HCT116 NRMT1−/− cells transduced with empty pCDH virus (control), virus overexpressing NRMT1 (NRMT1 O/E), or virus overexpressing NRMT2 (NRMT2 O/E) were also transduced with virus expressing SETα‐Dendra2. Pre conversion SETα‐Dendra2 expresses in the GFP channel, post‐conversion it expresses in the RFP channel. The RFP signal then decreases over time and a rate of decay can be calculated. (b) Western blots showing HCT116 cells express endogenous NRMT1 and were fully mono/dimethylated (me1/2RCC1) and trimethylated (me3RCC1) (lane 1). In contrast, HCT116 NRMT1−/− cells do not express NRMT1 or exhibit N‐terminal trimethylation, but retain mono/dimethylation (lane 2). In HCT116 NRMT1−/− cells overexpressing NRMT1‐FLAG, both NRMT1 protein and trimethylation were restored (lane 3). In HCT116 NRMT1−/− cells overexpressing NRMT2‐FLAG, a slight increase in mono/dimethylation can be seen, with no restoration of NRMT1 or trimethylation (lane 4). FLAG blot shows both NRMT1‐FLAG and NRMT2‐FLAG are expressing. Dendra2 blot shows SETα‐Dendra2 expression levels are similar between lines. GAPDH was used as a loading control. (c) First, the rate of decay of SETα‐Dendra2 was measured in control HCT116 cells (blue). This rate of decay significantly increased in HCT116 NRMT1−/− cells (red). Overexpressing NRMT1‐FLAG in HCT116 NRMT1−/− cells restores the original rate of decay (green), and there was no statistically significant difference between control and NRMT1 overexpression cell lines. Overexpressing NRMT2‐FLAG in HCT116 NRMT1−/− cells cannot rescue the decay (purple), which remains significantly faster than control. Curves were constructed by comparing loss of RFP signal over time as compared with time 0 and are the mean of three independent experiments ±SEM. *, **, *** denotes P < 0.05, 0.01, and 0.001, respectively, as determined by 2‐way ANOVA.
