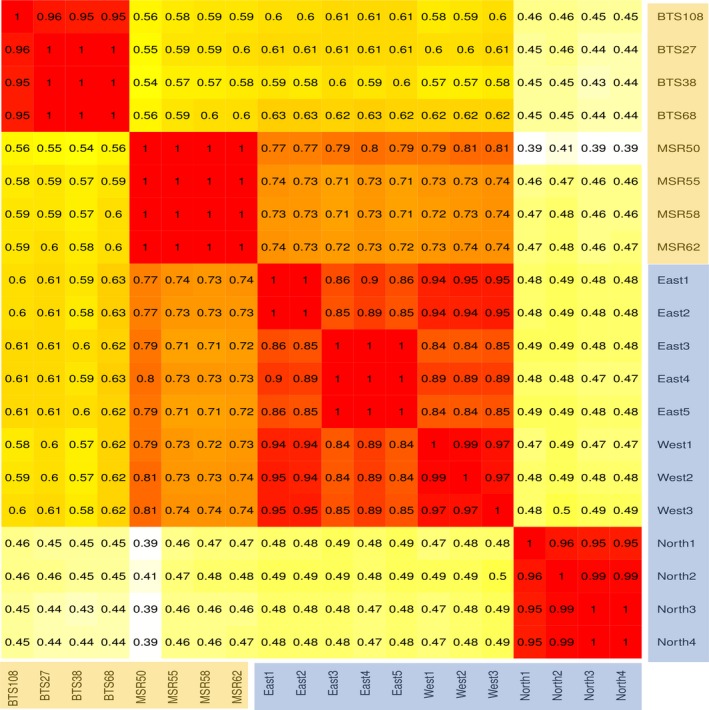
Figure 3.

Identity by state matrix which shows the proportion of pairwise shared alleles at each SNP site for all polymorphic loci across the mitogenomes. We compared eDNA samples from feeding traces (shaded in orange) with previously published mitogenome sequences (Kistler et al., 2015) shaded in blue. Warmer matrix colours indicate greater proportions of shared alleles at these loci
