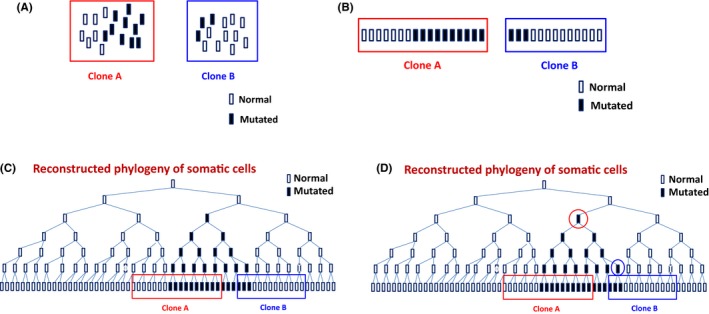
Figure 3.

A cartoon illustration showing that clones with higher mutation frequencies harbored the mutation longer than clones with lower mutation frequencies. A, Two clones or tissue samples, A and B, with different frequencies of the mutant allele. In this case, clone A has a higher frequency of the mutant allele than that of clone B. B and C, Since all somatic cells are descended from their parental cells (ie, by mitosis, one cell gives rise to two daughter cells), all cells in clones A and B, mutated or not, can be arranged based on their genetic similarity—ie, two cells are genetically closer if they share more similarity in terms of DNA sequences. D, For clone A, all cells carrying the mutant allele are descended from one common ancestor cell (circled in red) while all cells with the mutation are descended from the common ancestor cell that is circled in blue. However, this mutated cell, circled in blue, actually descended from the cell, circled in red, that is the common ancestor for all cells with the mutatnt allele in clone A. Therefore, clone A harbored the mutation earlier than clone B. The exact inference of this phylogenetic relationship would require statistical calculations with some very elaborate models. See, for example 374
