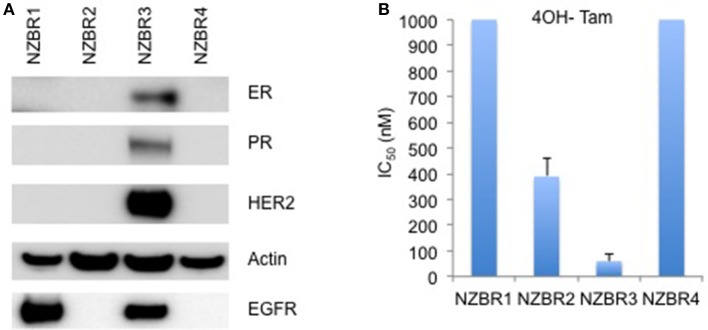
Figure 1.
Receptor expression, and growth inhibitory concentrations for NZBR cell lines exposed to tamoxifen. (A) Relative expression of estrogen receptor (ER), progesterone receptor (PR), HER2 and EGFR in NZBR1, NZBR2, NZBR3, and NZBR4 breast cancer cell lines. Actin is shown as loading control. (B) IC50 values (50% inhibition of growth) for tamoxifen, shown as the mean ± standard error of triplicate experiments. The highest tamoxifen concentration used (1,000 nM) is indicated where 50% growth inhibition was not reached.

