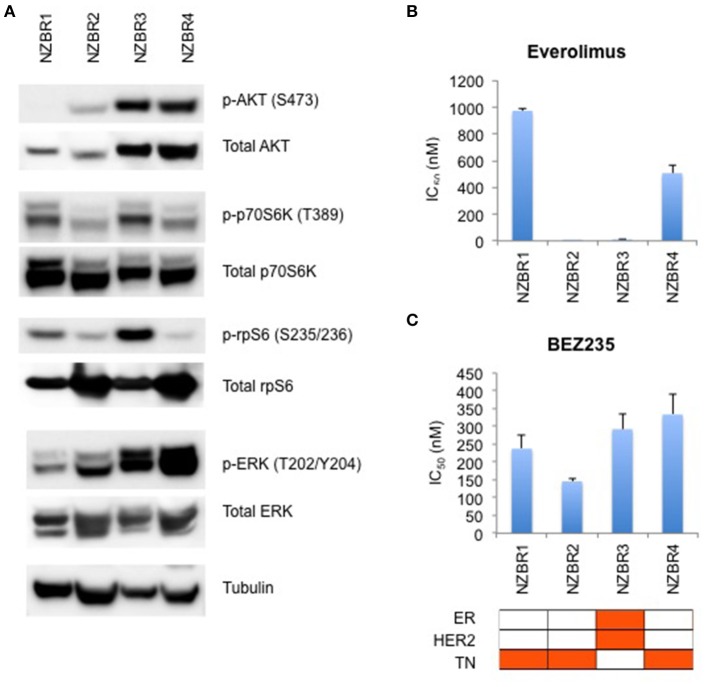
Figure 4.
Signaling pathway usage and growth inhibitory concentrations for NZBR cell lines exposed to different drugs. (A) Signaling pathway usage as measured by phosphorylation of AKT, p70S6K, rpS6 and ERK. Immunoblots with antibodies specific for phosphorylated proteins and their respective total protein are indicated. Tubulin is the loading control. IC50 values for (B) everolimus, and (C) NVP-BEZ235, shown as the mean ± standard error of triplicate experiments. Cell lines are identified as estrogen receptor (ER) positive, HER2 positive and triple negative (TN) (orange, here and below).

