
Figure 1.
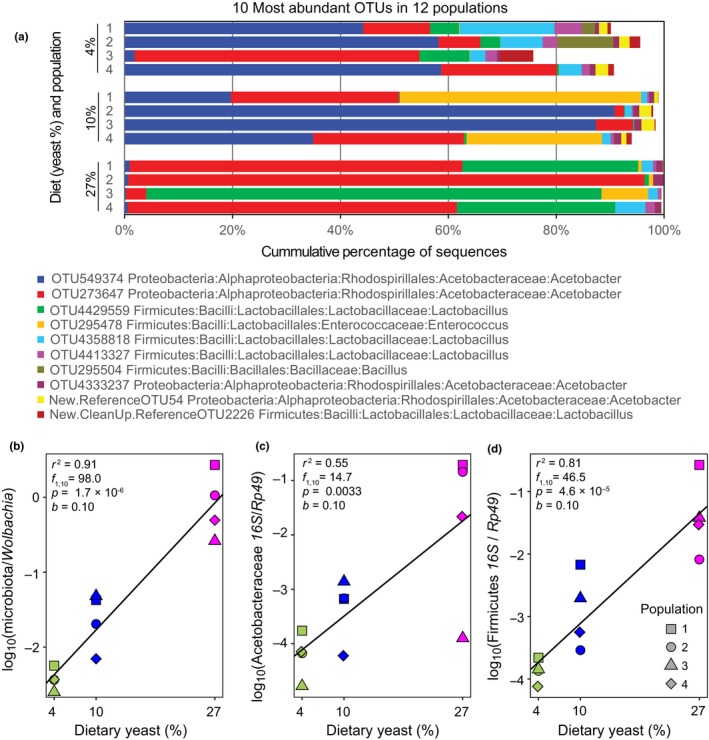
Structure of microbial gut communities and their abundances in Drosophila populations maintained on different diets. (a) The identities and relative abundances of 10 most abundant taxa in all populations as assigned by 16S rRNA gene amplicon sequence analysis. (b) The abundance of gut microbiota relative to the intracellular symbiont Wolbachia, estimated as the ratio of the 16S rRNA gene amplicon read counts. (c, d) Abundance of two dominant higher microbiota taxa, Acetobacteraceae (c) and Firmicutes (d), relative to host DNA, quantified by qPCR using taxon‐specific primers for bacteria and Drosophila Rp49 gene primers for the host. The lines in panels b–d represent linear regression on the log scale, and the statistics refer to the slope (b), adjusted R 2, and the significance test of the regression. The effect of diet remains significant if it is treated as a categorical variable (p < 0.0001, p = 0.016, p = 0.0003 in panels b, c, d, respectively; in all cases, the 27% diet is different from the 4% diet by Tukey's test). Symbol shapes identify different replicate host populations (their numbering is arbitrary, i.e., Population 1 from 4% diet is not paired with Population 1 from 10% or 27% diet)