
Figure 2.
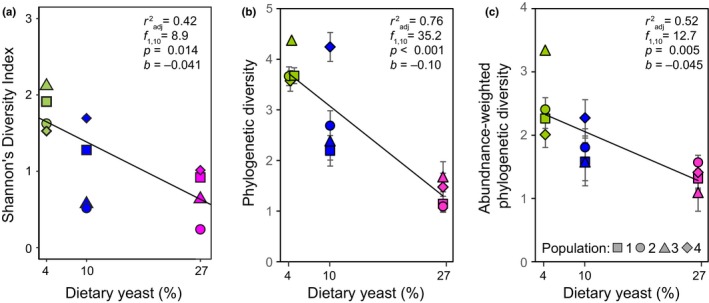
Alpha diversity of gut microbiota depending on the host diet. (a) Shannon's diversity, (b) phylogenetic diversity, and (c) abundance‐weighted phylogenetic diversity. The symbols and error bars (the latter omitted if smaller than the size of the symbol) indicate the means and standard deviations of index estimates calculated from 1000 data sets independently rarefied to the same sampling depth of 1779 reads (see Methods). The fitted lines and the statistics correspond to linear regression on the dietary yeast content; the effect of diet remains significant if diet is treated as a categorical variable (p = 0.014, p < 0.001, p = 0.009 for panel a, b, c, respectively; in all cases, the 27% diet differs from the 4% diet by Tukey's test)