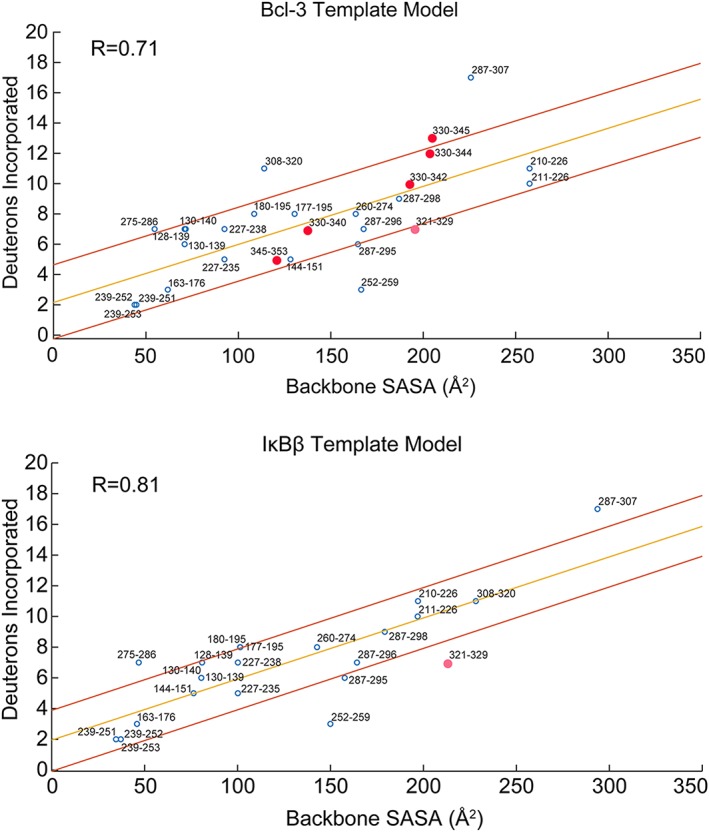
Figure 7.

Backbone solvent accessible surface area (SASA) correlates strongly with deuterium uptake from HDX‐MS. The GetArea server was used to calculate the backbone SASA for each residue in the homology models from the Bcl‐3 and IκBβ templates. These backbone SASA values were summed over each IκBε peptide generated from HDX‐MS and the deuterium uptake for each peptide is plotted as a function of backbone SASA. The upper panel shows the correlation for the Bcl‐3 template model whose correlation coefficient (R) is 0.71 and the lower panel is for the IκBβ template model whose R‐value is 0.81. Both plots show the correlation line from regression analysis in yellow with lines above and below in red indicating the region within one standard deviation of the regression line. For both models, the majority of HDX‐MS peptides fall within one standard deviation of the correlation line. The pink circle on both plots indicates the only peptide for the IκBβ template model containing part of the putative AR 7 of IκBε (Peptide 321–329, putative AR 7 begins at Residue 327), the backbone SASA for this peptide is overestimated from the IκBβ model based on the deuterium uptake. This peptide is better modeled by the Bcl‐3 template. Peptides spanning the putative AR 7 of IκBε (red data points) in the Bcl‐3 template plot all correlate very well for the Bcl‐3 template model, strongly suggesting the presence of a weakly folded AR 7 in the structure of IκBε.
