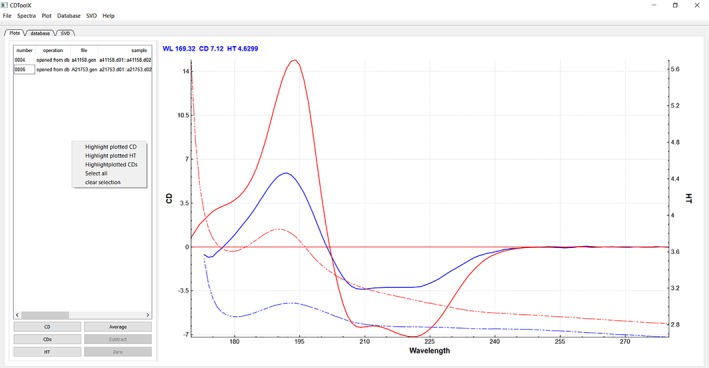
Figure 1.

Image of the “Plot” tab page, showing the menu and tab function positions and the commands accessible from this tab, including the main spectral display. Listings of files in use are on the left hand side of the panel, as are the other function buttons described in the text. The CD (solid lines) and HT (dashed lines) plots are located to the right of the panel, with the associated HT spectrum displayed in the same color as its cognate CD spectrum. In this example, the red spectrum corresponds to the protein hemoglobin, and the blue spectrum is of alkaline phosphatase. Both spectra were downloaded from the PCDDB22 (codes CD0000037000 and CD0000002000), respectively, and are components of the SP175 reference data base.27
