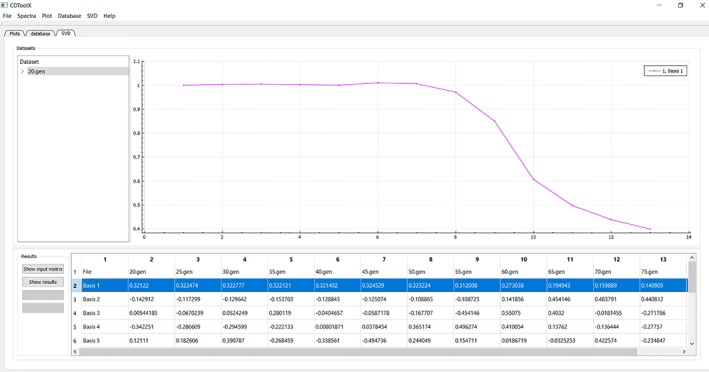
Figure 3.

An example of an analysis using the “SVD” tab function. The name of the component files of the datasets used are in the upper left hand panel, with the right hand upper panel displaying the plot derived for the highlighted data set (lower right panel, blue overlay). The data used in these plots are from reference 12.
