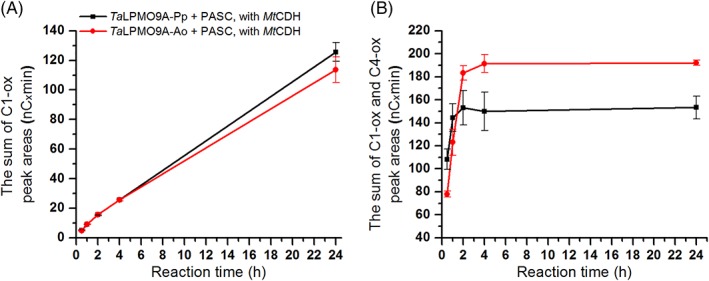
Figure 3.

Time course for release of oxidized products during incubation of 1 μM TaLPMO9A‐Ao (red line) or TaLPMO9A‐Pp (black line) with 2 mg/mL PASC and (A) 1 μM MtCDH, or (B) 1 mM ascorbic acid, in 40 mM Bis‐Tris, pH 6.5, at 45°C. The amount of released oxidized products for each sample is expressed as the sum of the integrated peak areas (nC × min) for C1 products only (A; in this case C4 products cannot be detected because they are oxidized by CDH) or C1 and C4 products together (B). Consequently, values on the y‐axis in the graph A and B should not be compared; quantification is only valid for comparing the two enzyme variants within the same panel.
