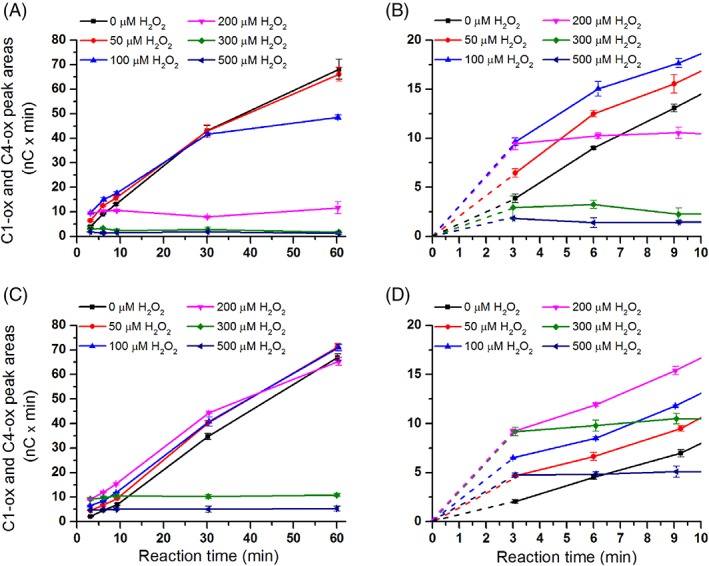
Figure 5.

The effect of H2O2 on product generation by TaLPMO9A‐Ao and TaLPMO9A‐Pp over time. The figures show time‐courses for the release of oxidized products in reactions containing 2.5 g/L PASC and 1 μM of TaLPMO9A‐Pp (A; zoom‐in view in B), or TaLPMO9A‐Ao (C; zoom‐in view in D), in the presence of different initial concentrations of exogenous H2O2 (0–500 μM) and 1 mM ascorbic acid. Note that this figure shows that increasing H2O2 concentrations lead to higher initial activity (clearly visible in panels B and D) and to higher rates of LPMO inactivation. The trade‐off between these two phenomena determines the apparent initial rate (measured at 3 min) and the overall shape of the progress curves.
