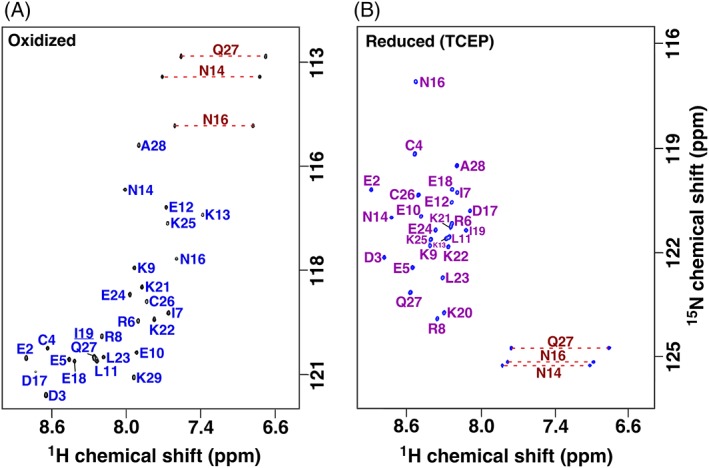
Figure 2.

Assigned 2D [15N,1H] HSQC spectra for gHH_44 collected in the oxidized (a) and reduced state (b). Spectra collected in 20 mM sodium acetate, pH 4.8 buffer, 20°C, at 800 MHz 1H resonance frequency without (a) and with (b) 2.5 mM TCEP. Amide side chain resonance pairs are connected by a red dashed line and are folded in the reduced spectrum. Note that the 15N chemical shift range shown is the same in both spectra, while the 15N carrier frequency is different.
