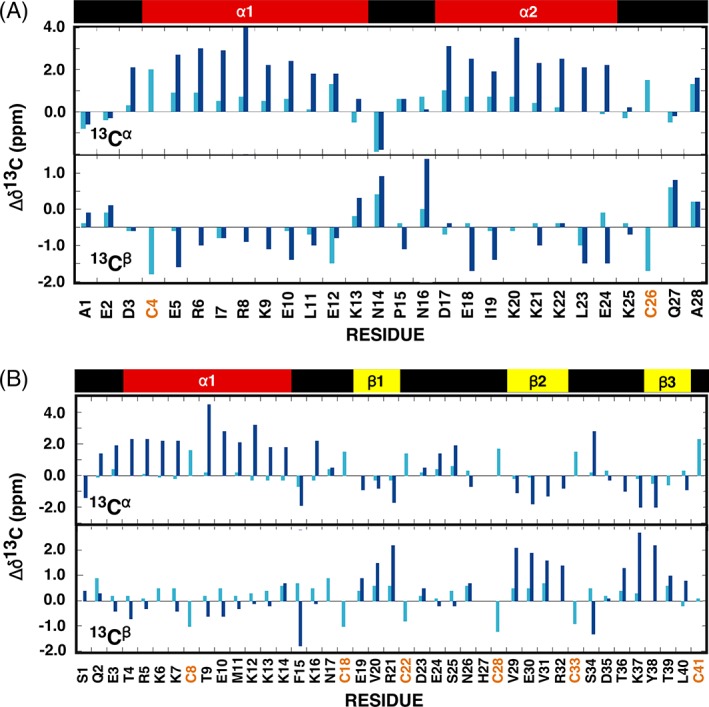
Figure 5.

Analysis of the observed 13Cα and 13Cβ chemical shift deviations from random coil values for gHH_44 (a) and gHEEE_02 (b) where Δδ13C = δ13CObserved − δ13CRandom coil. The random coil carbon values were taken from CNS (cns_solve_1.1) with no calculations for histidine and oxidized cysteine residues. Cyan = reduced (TCEP). Blue = oxidized. On top of the graph is a schematic illustration of the elements of secondary structure observed in the NMR‐derived structure for each oxidized peptide with the α‐helices colored red and β‐strands colored yellow.
