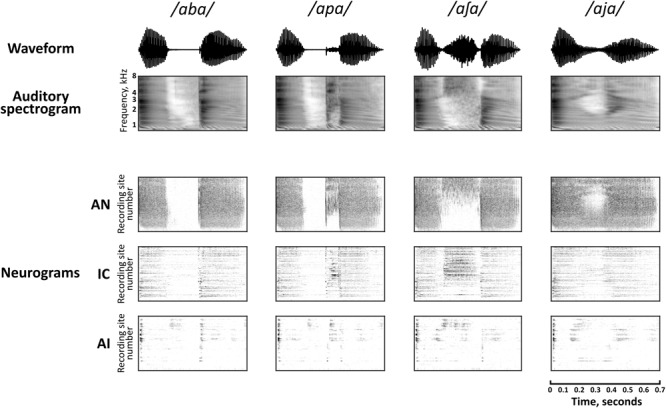
FIGURE 2.

Auditory spectrographic representations of a subset of the speech tokens, /aba/, /apa/, /a∫ a/, and /aja/ with the population responses to the same stimuli in the auditory nerve (AN), inferior colliculus (IC), and primary auditory cortex (AI). Auditory spectrograms were produced using the Matlab Auditory Modeling Toolbox (Søndergaard and Majdak, 2013) function audspecgram, whereby the frequency axis is displayed on an ERB-scale and the output is low-pass modulation filtered to reflect the spectrotemporal resolution of the cochlea. Neural population responses are shown as neurograms, whereby each row represents the spiking activity of a simulated nerve fiber (AN) or multi-unit recording site (IC, AI) using 10 ms bins, which are arranged by their characteristic frequency (CF) from low to high. Dark regions indicate higher firing activity. Note that this vertical scale does not match directly to the frequency scale of the spectrograms, since CFs are not uniformly distributed.
