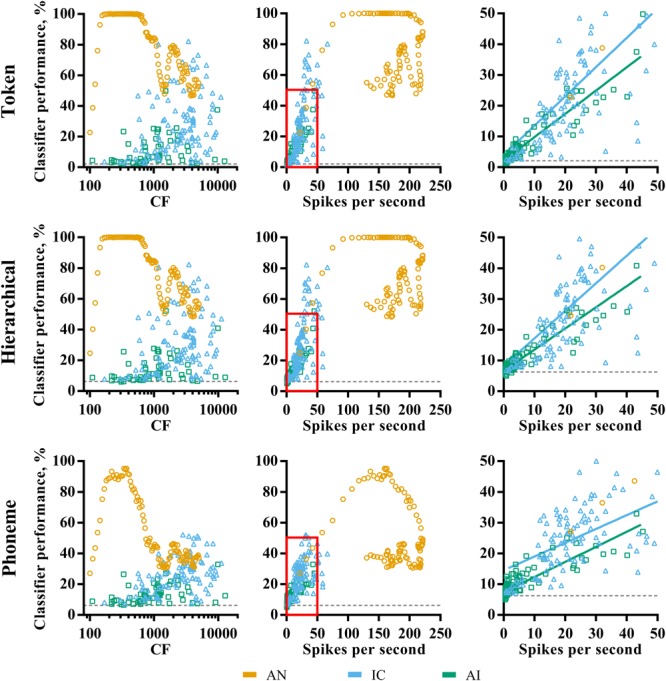
FIGURE 4.

Characteristic frequency (left column) and total average firing rate (middle column) as a function of classifier performance for each brain region (color; see legend) and classifier mode (row). The right column shows a magnified view of the region close to the origin on the firing rate vs. classifier performance axes, and the line of best fit for IC and AI. Sites that did not demonstrate frequency specific tuning to pure-tones in IC and AI are omitted. All points indicate the discriminability using the optimal smoothing window for each recording site.
