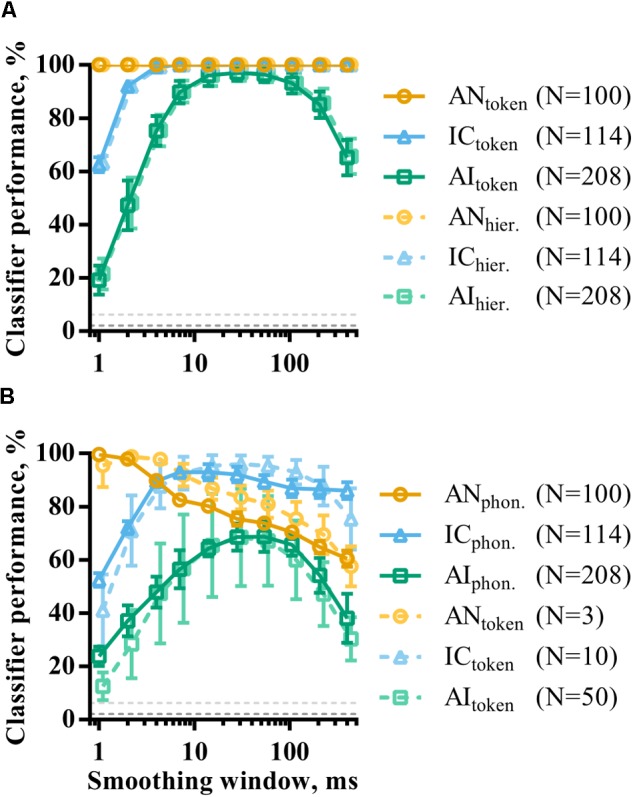
FIGURE 8.

The effect of smoothing on the discriminability of population representations of VCVs using token (A) and phoneme (B) classifier modes. Also shown is the same analysis for hierarchical classifier mode (dashed line, A). The dashed line in B is data from the token classifier using neuronal subpopulations from each brain region. The sizes of these subpopulations are indicated in the figure legend and were chosen such that the maximum token classifier performance was matched to that of the phoneme classifier.
