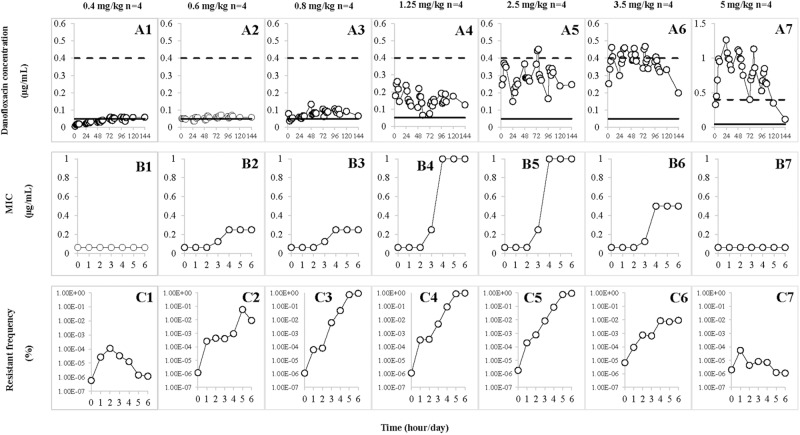
FIGURE 3.
Effect of danofloxacin concentration on loss of susceptibility and mutant enrichment. Concentrations of danofloxacin (0.4, 0.6, 0.8, 1.25, 2.5, 3.5, and 5 mg/kg) correspond to the different treatment groups once daily for 5 days. n is the number of tissue cages per group. (A1–A7) The concentration–time curves of different dosages of danofloxacin. (B1–B7) The values of MIC after each administration of danofloxacin, which corresponded to A1–A7. (C1–C7) The resistant frequency after each administration of danofloxacin, which corresponded to A1–A7. The dotted line represents MPC and the solid line represents MIC99 in A1–A7.

