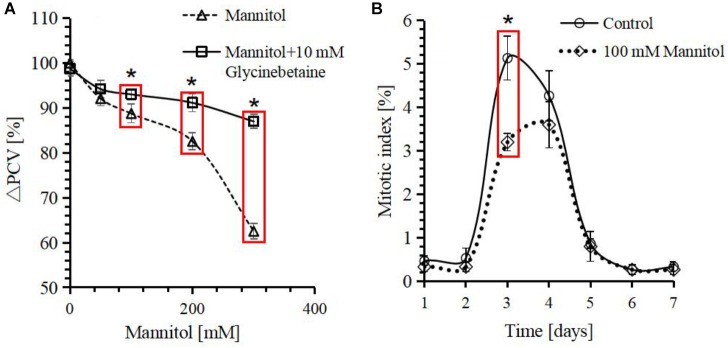
FIGURE 3.
Response of Citrullus lanatus cell growth treated with mannitol indicated by relative packed cell volume (ΔPCV) and mitotic index. (A) Decrease in PCV caused by mannitol can be rescued by the addition of glycinebetaine. The PCV of the 0 mM mannitol is defined as 100%. (B) Cell mitotic indices over time after subcultivation. Each point represents the mean value from three independent experiments (n ≥ 500). Values represent averages from three biological measurements and error bars represent standard errors. ∗Indicates significant differences in values in red box by a one-side t-test at a confidence level of p < 0.05.

