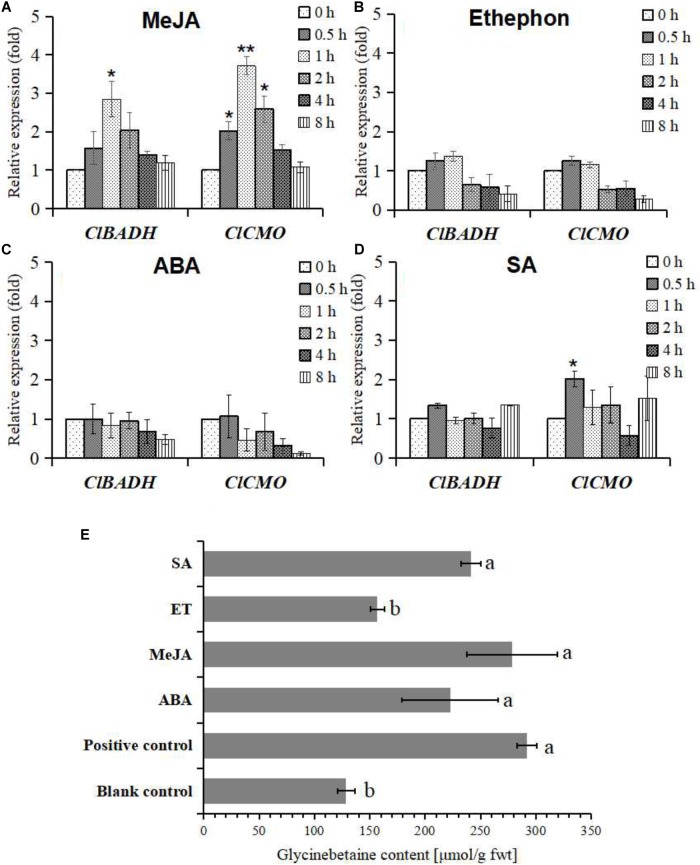
FIGURE 4.
Differential expression patterns of ClBADH and ClCMO and changes of glycinebetaine content in watermelon cells subject to various hormone treatments. (A) A total of 100 μM MeJA treatment; (B) 100 μM ethephon treatment; (C) 100 μM ABA treatment; (D) 100 μM SA treatment; (E) the glycinebetaine contents were determined by HLPC with 100 mM mannitol, 100 μM ABA, 100 μM MeJA, 100 μM ethephon, and 100 μM SA for 24 h, respectively. The cells were treated with 100 mM mannitol as a positive control and equal volume MS medium as a blank control for 24 h. Data represent mean values and SEs from three biological measurements. ∗ and ∗∗ indicate statistical significant difference at confidence levels of p < 0.05 or p < 0.01 by a one-side t-test. Values with different superscripts are significantly different at each treatment (p < 0.05).

