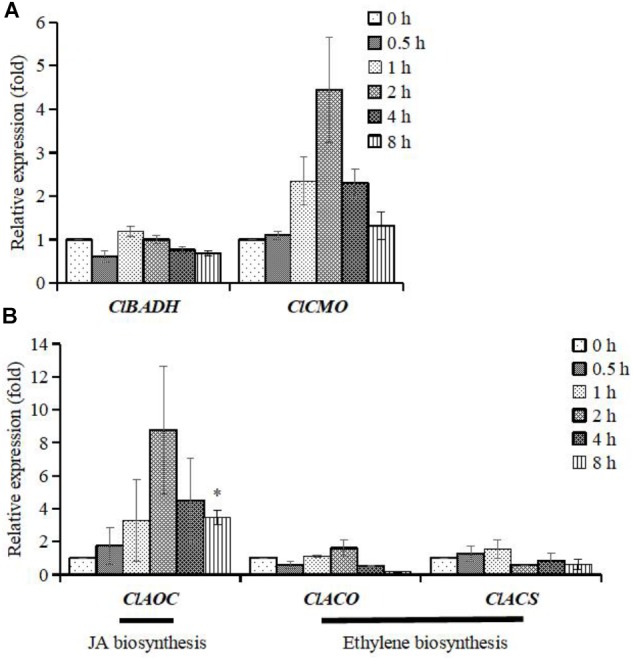
FIGURE 5.

Differential expression patterns of genes at different time points in watermelon. The cells of watermelon were treated with 100 mM mannitol for 0.5, 1, 2, 4, and 8 h. (A) The expression patterns of ClBADH and ClCMO; (B) the expression patterns of ClAOC, ClACO, and ClACS. ClAOC is a marker gene for JA signaling and the ClACO and ClACS are two marker genes for ethylene signaling. Values represent average means from three independent measurements; error bars represent standard errors. ∗Indicates significantly difference (p < 0.05) between the data point and 0 h data point.
