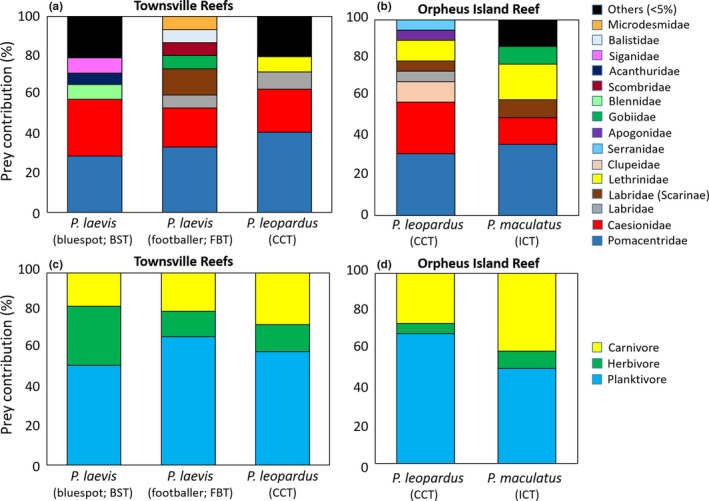
Figure 2.

Prey family (a,b) and prey functional mode (c, d) contribution (%N) calculated from DNA stomach analysis from 31 P. leopardus (CCT), 22 P. laevis (bluespot; BST), 10 P. laevis (footballer; FBT) captured at Townsville (TSV) reefs (Helix, Coil, and Dip Reefs combined; a, c) and 9 CCT, 9 P. maculatus (ICT) captured at Orpheus Island (OI) Reef (b, d). Prey families that consisted of <5% of total prey for each consumer group were combined as “Others”
