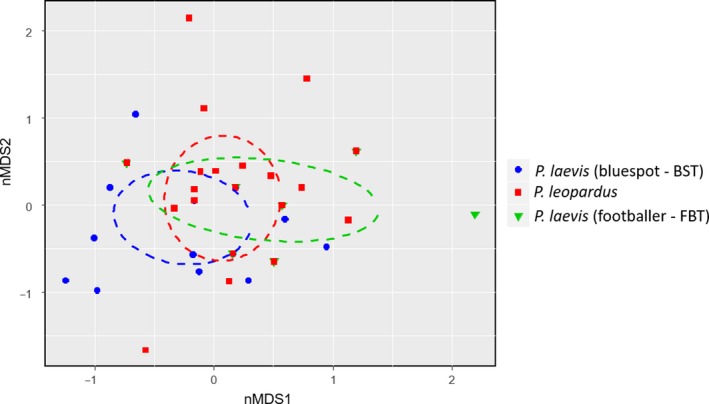
Figure 3.

Nonmetric multidimensional scaling (nMDS) plot characterizing DNA stomach analysis relative to prey family of Plectropomus spp. at TSV reefs (Helix, Yankee, and Coil Reefs). A two‐dimensional Bray–Curtis dissimilarity index was used resulting in a stress level of 0.08, ANOSIM R‐statistic of 0.05, and p‐value of 0.14
